In Operando Monitoring by Analysis of Backscattered Electrons during Electron Beam Melting
Electron beam melting (EBM) is an additive powder-bed fusion process, which builds up bulk metallic components by a defined sequence of process steps. Like other additive processes, EBM enables the cost-effective fabrication of complex components in small batches. Nevertheless, to compete with conventional manufacturing methods, high-quality standards have to be fulfilled, which is currently seen as a barrier for the breakthrough of additive manufacturing technologies. Better insight by process monitoring is necessary but so far, there is still a lack of reliable tools for metal additive manufacturing. [...]
Please register below to read the full article digest.
Introduction
Electron beam melting (EBM) is an additive powder-bed fusion process, which builds up bulk metallic components by a defined sequence of process steps. Like other additive processes, EBM enables the cost-effective fabrication of complex components in small batches. Nevertheless, to compete with conventional manufacturing methods, high quality standards must be met, which is currently a barrier for breakthrough additive manufacturing technologies. Better insight by process monitoring is necessary, but, so far, there is still a lack of reliable tools.
Most of the work done on process monitoring during EBM focuses on the use of infra- red (IR) thermography. Drawbacks of this approach are the high amount of data to be processed and the susceptibility to errors. The detection of backscattered electrons (BSEs) has been suggested as an alternative for EBM process monitoring.
Electron optical (ELO) images can be obtained using the electron beam in a way that is comparable with scanning electron microscopy. The beam is used to record the topography of the molten surface, enabling qual ity control engineers to compare the features and defects in the ELO image to the final sample’s surface. This has the potential to be used to deduce processing windows in a fast and reliable manner. Despite the benefits of this approach, it requires an additional process step for image acquisition and is only capable of imaging the final molten surface, increasing the build time. In addition, the nature of the test means that it’s not suitable for a real-time correction of the process parameters by a closed-loop control.
This chapter discusses how these limitations can be overcome by recording the BSEs directly during the melting of the layers in an in operando approach. This approach would not increase the build time and can deliver information about the process quality in real time.
Methods
The experiments were conducted using the Athene system and its integrated BSE detection hardware. A more detailed descrip tion of this in-house developed EBM system can be found in Arnold et al. In the first experiment, single-square-shaped areas were made molten on a base plate made of X15CrNiSi20-12 stainless steel at room temperature. The experiment was designed to deliver basic information about electron backscattering during melting without considering the complex conditions of an EBM process, such as the interaction between the beam and powder bed. In the second experiment, three cuboid samples with a constant layer thickness of 50 μm were produced by EBM. A Rigol MSO1104Z oscilloscope was used for recording the BSE and deflection signal during melting and saving the data. A detailed description of the experimental setup and methods can be found in the full article of this digest version.
The as-built samples were further investigated using an Olympus LEXT OLS4000 laser scanning microscope. Standard laser scanning microscopy (LSM) was used to acquire optical images of the molten surfaces, whereas confocal laser scanning microscopy (CLSM) enabled 3D measurements of the surface topography. The microscope’s stitching feature was used to acquire images of the whole sample surface with a spatial resolution of approximately 3 μmpx-1 for both LSM and CLSM.
Results
Figures 1 and 2 show the molten surfaces of the base plate and the powder bed experiment, respectively. In both figures, the comparisons show the in operando ELO signal, optical images of the as-built surface by LSM, and the surface topography obtained by CLSM. The scaling of the linear color map was adjusted for each image to obtain maximum contrast (Table 1).
Table 1. Color‐map scales and process parameters of images in Figure 1 and 2. The measured BSE signal is normalized to the beam power to achieve comparable values between different samples.
| Height [μm] | BSE signal [V kW−1] | |||||
| Sample | Min | Max | Min | Max | Power [W] | Velocity [m s−1] |
| Base‐plate, 50 μm | 68 | 493 | 2.05 | 2.76 | 600 | 1.00 |
| Base‐plate, 100 μm | 104 | 1122 | 1.98 | 2.66 | 600 | 0.50 |
| Base‐plate, 200 μm | 268 | 565 | 1.76 | 2.48 | 600 | 0.25 |
| Powder‐bed, porous | 230 | 577 | 1.52 | 1.93 | 150 | 1.00 |
| Powder‐bed, dense | 161 | 450 | 1.36 | 1.75 | 1000 | 5.00 |
| Powder‐bed, bulging | 490 | 1425 | 1.26 | 1.67 | 1000 | 3.33 |
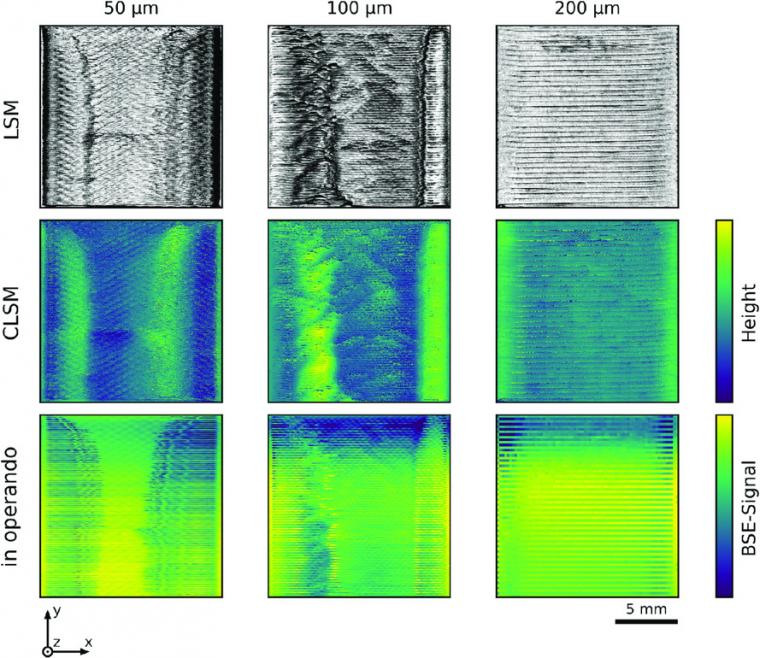
Despite keeping the area’s energy density constant, the analysis by LSM/CLSM shows a different surface topography for each hatch line spacing. The 50 μm sample has a range (i.e., distance between the lowest and highest points) of around 450 μm. There are two big, distinct elevations with a rather smooth profile, which are extended in y-direction. The middle part of the surface is flat but shows a slight, periodic texture. The 100 μm sample shows a very high range of around 1000 μm. Again, there are two big elevations extending in the y-direction whose profiles are rough and jagged. The 200 μm sample is fairly flat with a range of around 300 μm. On the left and the right sides, there is a slight elevation of the surface. The visibility of the single melt track increases with bigger hatch line spacing.
The lower part of Figure 1 shows the images obtained after processing the in operando ELO signal. For all three samples, the normalized signal lies in a similar range of 1.7–2.8 V kW-1 (Table 1), and the line-by-line reconstruction of the image is clearly visible. On the left and the right sides, the 50 μm sample shows two large, distinct regions of low signal intensity. In the middle part, the intensity is higher but shows a weak periodic pattern. The 100 μm sample shows a complex distribution of signal intensity. The upper part of the image has a low but, toward the center, gradually increasing intensity. The main part with a medium intensity can be distinguished from the left and right sides by a clear boundary. These outer regions show several local intensity maxima, which seem to have a line-like shape. In addition, the left one of these regions encloses a medium-sized area with low signal intensity. The 200 μm sample is poor in details. The upper part of the image shows a lower intensity than the other parts that are dominated by a line-wise alternating intensity pattern.
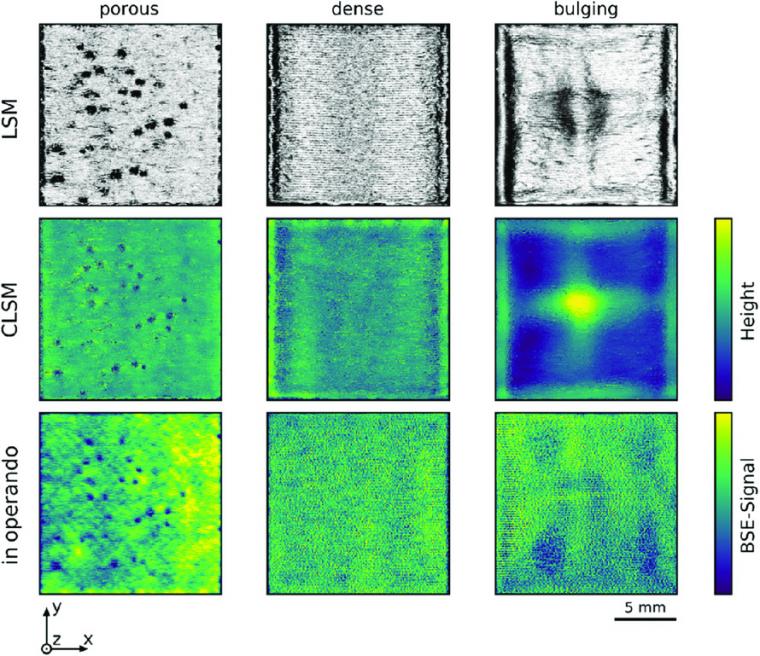
The LSM/CLSM analysis of surface topography shows that the porous sample has a rather flat surface with several scattered voids (Fig. 2). The range of this sample is about 350 μm. The dense specimen is almost perfectly flat with only small elevations toward the boundaries of the sample. This is also reflected by the small range of around 300 μm. In contrast, the bulging sample has a very uneven surface with a smooth cross-shaped elevation in x/y-orientation, a distinct local maximum in the center of the sample and strongly elevated edges. The range is at a high value of around 950 μm. On the surfaces of all three EBM samples, the single melt tracks are slightly visible.
The lower part of Figure 2 shows the images obtained by processing of the in operando ELO signal. After normalizing the images to the respective beam power, the signal lies in a similar range of 1.2–2.0 V kW1 (Table 1). Compared with the base-plate experiment, the line-by-line reconstruction of the images is hardly visible. The porous sample shows a smoothly varying intensity distribution with single spots of very low signal. In contrast, the dense sample has a very homogeneous but noisy intensity distribution. The bulging sample has a similar signal structure but, in addition, distinct regions with lower intensity are visible.
Discussion
The comparison of the surfaces acquired by CLSM and the images obtained by processing of the in operando ELO signal indicates some remarkable correlations in both experiments. In case of the 50 μm base-plate sample, the shape of the low-intensity regions fits very well to the shape of the corresponding elevations. Even details such as the protrusion in the right region or the slight texture in the brighter middle part are depicted correctly. In the 100 μm base-plate sample, the elevated structures are also clearly visible in the in operando ELO image, and details such as shape and size of the topographical features are depicted remarkably accurate.
Similarly, the porous powder-bed sample shows an excellent correlation between actual pores on the surface, and the intensity decreases in the in operando ELO signal. This is valid for both the position as well as the size of the pores. As to be expected, the dense powder-bed sample with its flat surface shows no remarkable details in the in operando ELO image. In contrast, the correlation between the two imaging methods is more complex for the bulging powder-bed sample. Using the in operando ELO approach, the elevated structures are not clearly visible as those in the base-plate experiment.
The topography contrast can be seen at the edges of the bulging areas in Figure 1 and 2 where a change of the local incident angle results in a variation of the measured BSE signal. The effect is even more pronounced at the steep edges of pores. Inside these cavities, multiple scattering of the electrons decreases the signal intensity even more and thereby further facilitates the detection of pores. In contrast, an even surface reflects the major part of the BSEs in direction of the incident beam, which coincides with the position of the BSE detector in the current experiment. Therefore, while comparing CLSM and in operando ELO images in terms of topography, it must be noted that the imaging principles are strongly different. While the first is designed to return absolute elevation data, the second delivers information about the interaction between electron beam and material, which is virtually independent of the absolute height. This leads to the images of the porous surface which are quite similar for both methods, whereas the images of the bulging samples are more difficult to compare.
An enhanced understanding of the correlation between in operando BSE signal and beam-material interaction is necessary to apply the approach to a real-time feedback control system. It should be emphasized that the presented concept of mapping the recorded in operando signal to a 2D intensity map is considered a tool to identify quantitative process quality metrics in future experiments. To eventually apply these findings to a system that is capable of automatically optimizing process parameters in real time, a direct analysis of these metrics in the continuous in operando signal is to be preferred to achieve the best performance.
Conclusion
For the first time, the acquisition of ELO images during the melting step of the EBM process was performed. The obtained signal intensity maps show a remarkable correlation to the final topography of the molten samples. The approach is capable of detecting pores and bulging areas, whereas the image quality differs between base-plate and powder-bed experiments. It is assumed that the image contrast is dominated by the effect of surface topography on the emission of BSEs, but further understanding of the signal formation has to be acquired in subsequent experiments. As soon as the reliable interpretation of the in operando ELO signal is accomplished, it might be the essential part of a powerful feedback control system. By gathering information about the molten surface quality in real time, the system could be capable of optimizing process parameters during melting. An advanced control system like that would make a big contribution to the reliability of the additive manufacturing process and the quality of the produced components.
Source: Preview Image: flyalone/stock.adobe.com