Assessment of Possibilities of Ceramic Biomaterial Fracture Surface Reconstruction Using Laser Confocal Microscopy and Long Working Distance Objective Lenses
A numerical description of fracture is an essential step in searching for the correlations between specific micromechanisms of decohesion and material characteristics designated with the use of fracture mechanics methods. This issue is critical to search for fundamental relationships between chemical composition, technology, structure, and properties of materials. It often happens that fracture surfaces are well developed, which can significantly hinder or even prevent the measurement and reconstruction of the tested material surface geometry. Herein, comparative measurements of a biomaterial surface were performed using laser confocal microscopy.
Introduction
Qualitative fractography often provides enough knowledge about material fracture mechanisms and fracture morphology but does not give any information useful for designing of new materials. These deficiencies are compensated by quantitative fractography, which enables the presentation of fractographic analysis quantitatively. Measurement of characteristics on a fracture surface and the use of stereological parameters allow a more thorough assessment of the fracture process.
The combination of fractographic observation techniques and geometric parameters obtained with quantitative fractography methods gives a comprehensive picture of the fracture process. [1–3] A numerical description of fracture is important in the search for the correlation between specific micromechanisms of decohesion and material characteristics designated with the use of fracture mechanics methods. [4–6] In this article, comparative measurements of a biomaterial surface were performed using laser confocal microscopy. To this end, short working distance lenses designed to be used with a focused UV laser beam and long working distance objective lenses were used.
Confocal laser scanning microscopy (CLSM) is an imaging method for material surfaces at the nanometer scale. [7–9] The basic premise of CLSM is to obtain a high-resolution, sharp image of the sample, which is mainly achieved by eliminating images outside the lens’s focal plane. [7,10] In a confocal microscope, the signal used for image formation reaches the sample area where it is then reflected. The reflected beam must have a small diameter and a large angle of divergence to get a very high resolution. Owing to this, the signal is focused on the detector aperture in a plane common with the lens focal plane. The signal only reaches the focal plane, and the result is an image of the sample in its cross sections. Then, the images can be saved and combined, giving a three-dimensional image of the entire surface with an increased depth of focus (all image elements are sharp and clear).
Optical microscopy methods are used for surfaces where contact with the surface is unacceptable due to the material sensitivity and specificity. There is characteristic variation in the quality and accuracy of the analysis of surfaces obtained using a laser confocal microscope compared to the analysis obtained using a profilometer due to the nature of the respective probes used in each. [11,12] In profilometry, the large surface area needle makes it impossible to measure the asperities smaller than the probe (Figure 1). The laser confocal microscope does not have this deficiency— it can measure an area's roughness at much higher resolution (Figure 2).


Methods
The study of ceramic surface morphology was performed using the Olympus LEXT OLS4000 laser confocal microscope. The lenses used in the microscope are designed for microscopic tests involving an observation technique in a bright field of view. This technique involves illuminating the sample with a light beam in the form of a cone (previously formed by a condenser) so that all the light covered by the lens apparatus falls on the sample. The obtained contrast results from the differences in light absorption and scattering by different areas of the sample surface. [13]
The Olympus LEXT OLS4000 microscope has a motorized revolving nosepiece that enables an automatic change of the lens during testing. The system automatically adjusts the image sharpness and the light intensity, which allows an easy and quick change of magnification. The lenses mounted in the nosepiece were either semi-apochromatic or apochromatic [14] and ranged from 2.5× to 100×. LEXT dedicated lenses have reduced aberration, which is influenced by a higher numerical aperture and an enhanced optical system, giving a high performance for a 405 nm laser beam. However, they also have a small working distance (1 mm to 0.35 mm); thus, alternative long working distance lenses were also available for surfaces with a high degree of development.
To assess the suitability of long-distance lenses for reconstructing of the geometry of a surface with a relatively high degree of development, it is necessary to carry out comparative studies of short- and long-distance lenses. The test surface cannot be too developed to enable analysis with the lens having the shortest working distance. For comparative studies, an aluminum oxide (Al2O3) sample with a relatively flat surface was deposited electrolytically on an aluminum alloy.
Results and Discussion
To compare the results of analyses obtained using two types of lenses mounted on two different revolving nosepieces, it was necessary to develop a system of analysis, which would enable us to observe precisely the same areas after replacing the revolving nosepieces. For this purpose, the option of stage coordinates available in the microscope software was used, and nine coordinates of the table’s position with the sample were defined (Figure 3). The observed surface was centered relative to the characteristic place in the observed image, and, additionally, screenshots of the observed area were performed (Figure 4).
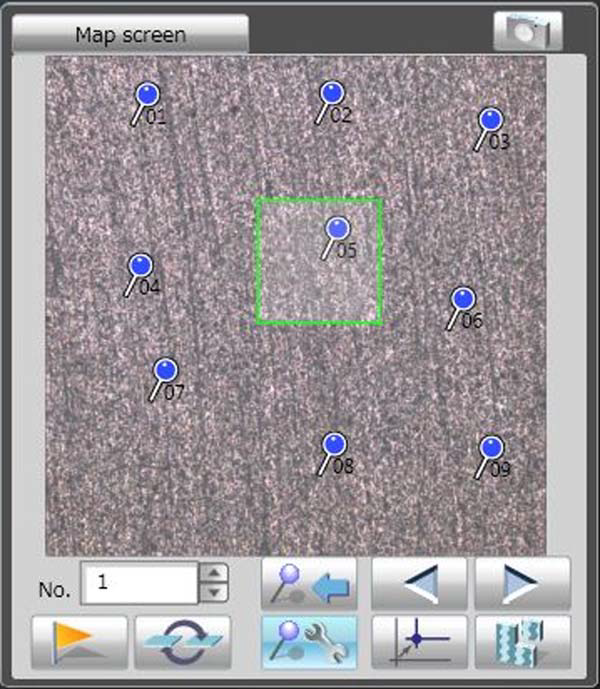
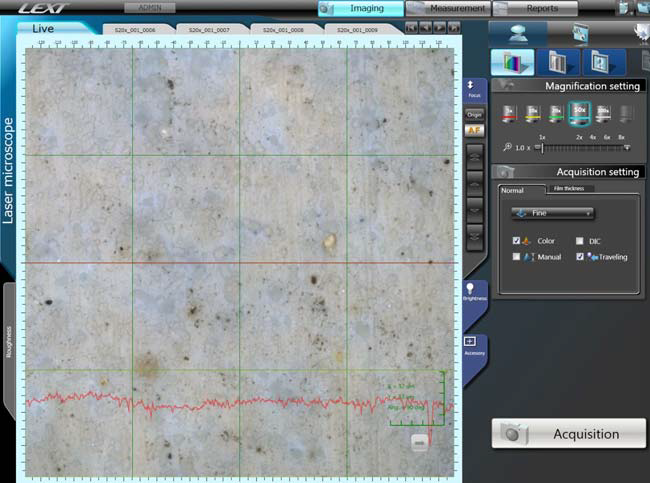
First, the ceramic coating sample was analyzed in the nine different locations, using the 20× and 50× LEXT lenses with short working distances. The sample was preset using the table coordinates, and then its position was corrected manually by observing the sample with the 50× lens and using previously captured screenshots. This procedure ensured that the observed area was the one that was previously measured.
Second, the sample was observed using 20× and 50× lenses with a larger working distance. It was necessary to calculate the table settings by adjusting the previously set coordinates to repeat the centering of the observed surface using the previously captured screenshots. The results of observation with short-distance and long-distance lenses are given in Figure 5 and Figure 6.
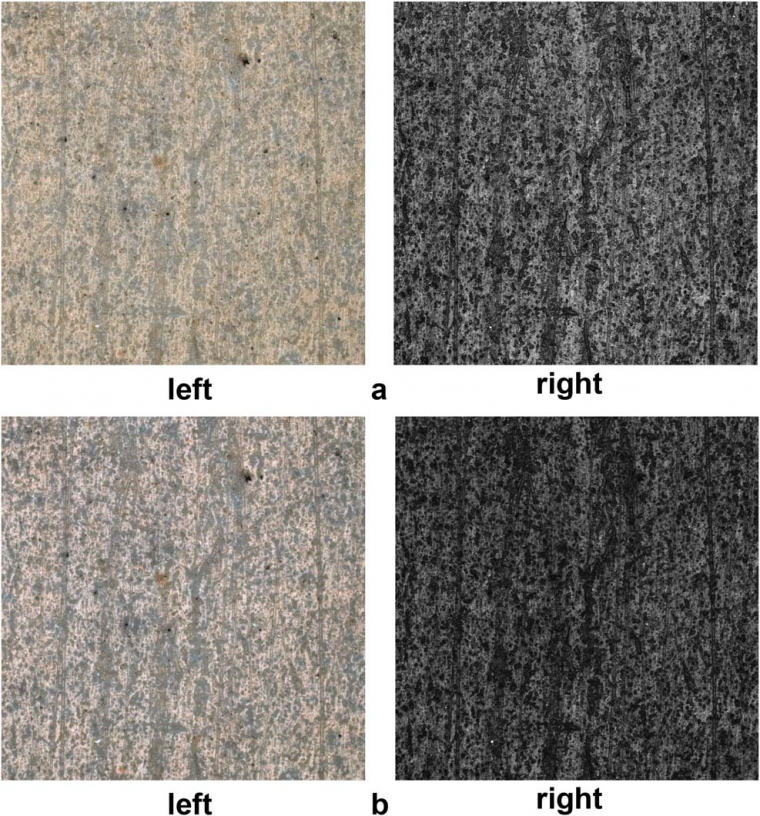
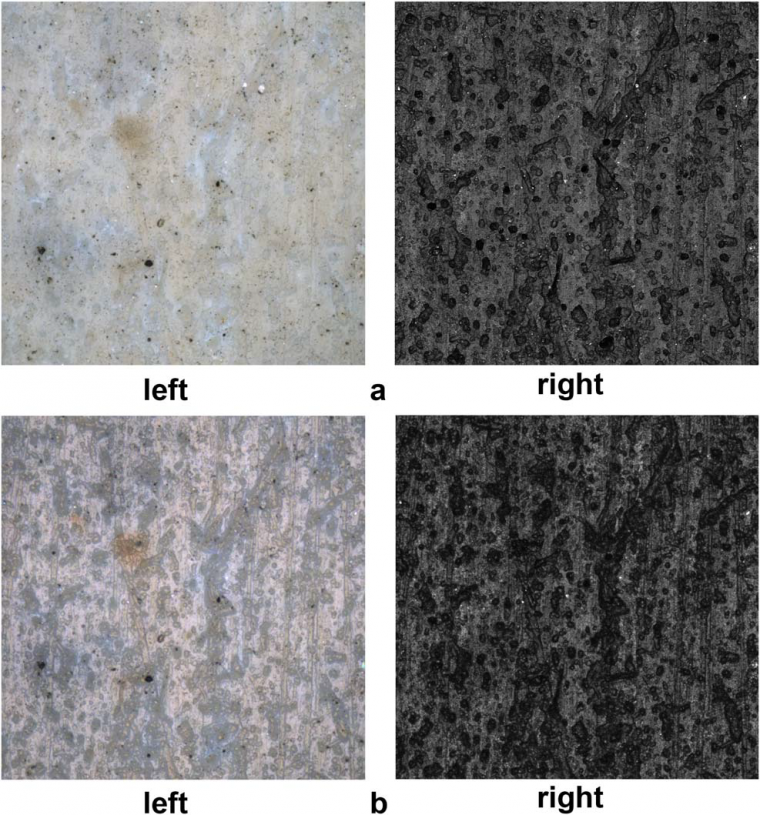
20× lenses enabled observation of the surface sized 639 μm 3 639 μm with a sampling step of 625 nm in the X and Y axes, and 485 pm in the Z-axis. 50× lenses enabled observation of the surface sized 256 μm × 256 μm with a sampling step of 250 nm in the X and Y axes, and 208 pm in the Z-axis. The surface observation was carried out in 2D (white light) and 3D fine (laser light) modes, and the obtained images had a resolution of 1,024 points by 1,024 lines.
For all measurement data, an analysis of the surface morphology was performed (Figure 7) using the height parameters, [15] namely Sq, Sp, Sv, Sz, and Sa, where: Sq—Root mean square height is the standard deviation of the height distribution or RMS surface roughness. Sp—Maximum peak height is the height between the highest peak and the mean plane. Sv—Maximum pit height is the depth be- tween the mean plane and the deepest valley. Sz—Maximum height is the height between the highest peak and the deepest valley. Sa—Arithmetical mean height is the mean surface roughness.
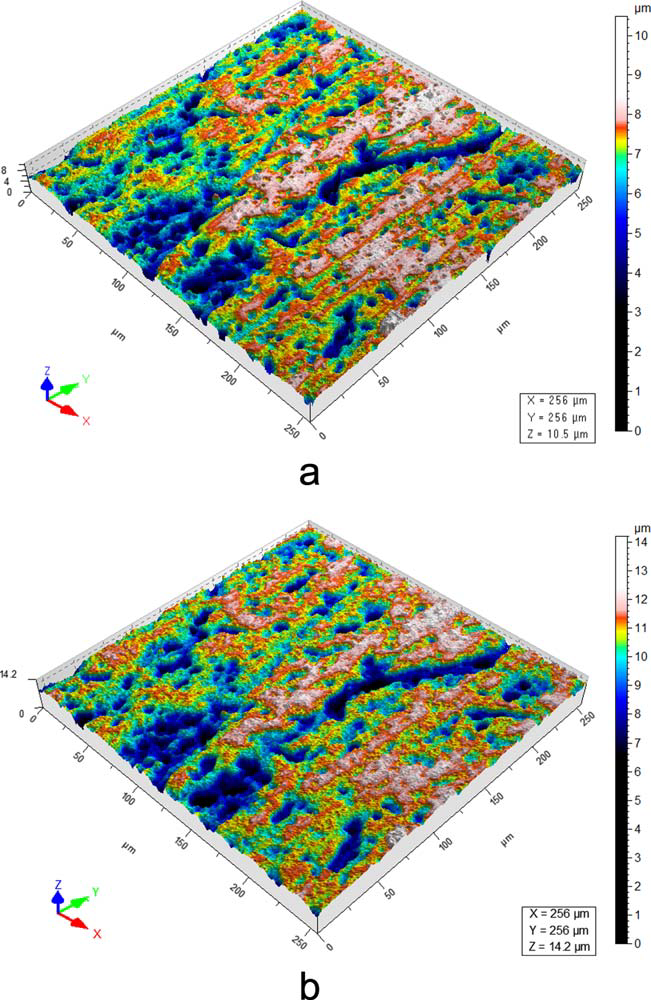
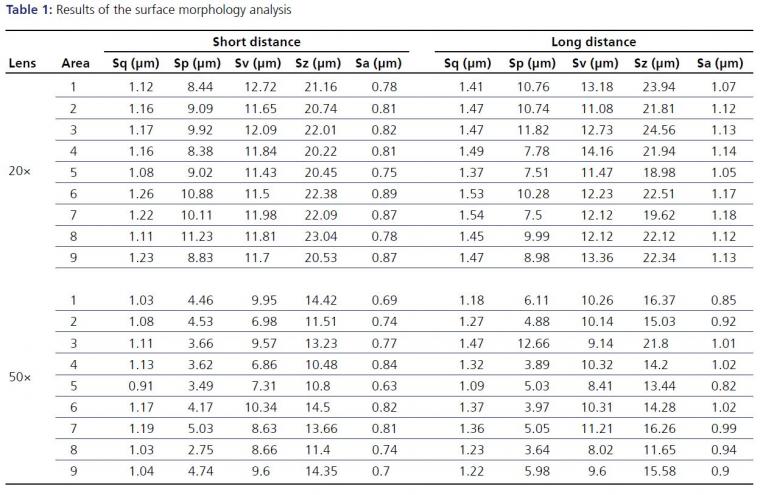
These parameters belong to the height parameters included in ISO 25178-2. [15] Height parameters are a class of surface finish parameters that quantify the Z-axis perpendicular to the surface. The results of the surface morphology analysis are given in Table 1.
When analyzing the images (Figure 5 and Figure 6), it can be noticed that the long-distance lenses give a better quality of an image observed in white light than the short-distance dedicated LEXT lenses. The opposite is the case when dimensional images obtained under the illumination of the surface with a focused laser beam are compared. A comparison of the surface morphology analysis (Table 1) for 20× lenses shows that relatively higher height parameters were obtained for the long-distance lenses compared with the short-distance ones. The situation is similar when comparing 50× lenses. However, the differences are much smaller than in the case of 20× lenses.
Synak et al. successfully used the Sq parameter to compare roughness measurement results obtained with different methods. Given the large difference in the measurement principle and the large difference in the size of the measured surface areas, which exist in both methods used, [16] the authors concluded that results’ compatibility is high. Greater divergence of results occurred in the case of surfaces with Sq less than 2 nm. A large change of this parameter depending on the test area was found when examining such surfaces, which indicates that the heterogeneity of the height of surface roughness may be the leading cause for the measurement differences.Thus, to emphasize the differences between the surfaces, subtraction of surfaces obtained for both types of lenses was performed. The value of the RMS parameter (Sq, root mean square deviation) of the resulting surface allows verifying the quality of the subtraction. [15] Sq values are given in Table 2. The values of RMS are satisfactory and prove that the observed surfaces are very similar.

Conclusions
To conclude, it was found that an indisputable advantage of confocal microscopes is that they provide images of very high quality and resolution compared to conventional optical microscopy. The sharpness is not only limited to an area or point but the entire image. Bright and clear images result from using a confocal aperture and advanced lenses arranged in front of the detector. Detector signal selection, specialized shapes, and the lenses inside the objective give clear, colorful, and sharp images, which enable the imaging of individual elements of the sample surface. Two-dimensional observations allow the testing and analysis of individual surface layers, whereas three-dimensional observations enable the observation of diverse surface shapes and assess the quality of materials. Lastly, long-distance lenses made it possible to reconstruct the material surface geometry and the description of its morphology.
References:
[1] J. Cwajna, S. Roskosz, Mater. Charact. 2001, 46, 183.
[2] S.W. Freiman, J.J. Mecholsky, Quantitative Fractography. In: The Facture of Brittle Materials: Testing and Analysis. Hoboken, NJ: Wiley, 2012, pp. 191.
[3] G.D. Quinn, Guide to Practice for Fractography of Ceramics and Glasses, NIST Special Publication SP 960–16, 2007, Washington: U.S. Government Printing Office.
[4] D.R. Moore, A. Pavan, J.G. Williams, Fracture Mechanics Testing Methods for Polymers, Adhesives and Composites. 2001, ESIS Publication 28. Oxford, UK: Elsevier.
[5] S. Stach, Key Eng. Mater. 2011 465, 271.
[6] G.D. Quinn, Microsc. Anal. 2008, 22, 21.
[7] R.W. Kelsall, I.W. Hamley, M. Geoghegan , Nanotechnologies. Warsaw: Polish Scientific Publishers PWN 2009.
[8] S.W. Paddock, Mol. Biotechnol. 2000 16, 127.
[9] F. Ren, I.OP Smith, M.J. Baumann, E.D. Case Int. J. of Appl. Ceramic Technol. 2005, 2, 3, 200.
[10] W. Brutkowski, Kosmos 2013, 62, 171.
[11] M.W. Davidson, M. Abramowitz. Optical Microscopy. In: Encyclopedia of Imaging Science and Technology, 2002, NY: Wiley. pp. 1106–1141.
[12] S. Stach, Key Eng. Mater. 2011, 465, 271.
[13] “LEXT OLS4000 Industrial Laser Confocal Microscopes - Olympus 3D Laser Measuring Solution.” Olympus, 6 May 2011, www.olympus-ims.com/en/metrology/ols4000.
[14] “Semi Apochromat Color Correction Brightfield Objective Lenses | LMPLFLN | Olympus.” Olympus, 2 May 2011, www.olympus-ims.com/en/microscope/lmplfln.
[15] ISO 25178-2, Geometrical Product Specifications (GPS) - Surface texture: Area - Part 2: Terms, definitions and surface texture parameters, Geneva: International Organisation for Standardization, 2012.
[16] R. Synak, M. Pawełczak, W. Lipinski, W. Gocman, Electron. (Inform. Technol.) 2013, 54, 46.
Original publication:
Stach, S., Sapota, W., Wróbel, Z. and Ţălu, Ş. (2016), Assessment of possibilities of ceramic biomaterial fracture surface reconstruction using laser confocal microscopy and long working distance objective lenses. Microsc. Res. Tech., 79: 385-392. doi:10.1002/jemt.22641
Source: Preview Image: bjul/Shutterstock

