Application of Confocal Microscopy for 3D Visualization of Tracks in Solid-state Nuclear Track Detectors
Inhalation of radon gas is considered to be associated with about 1,100 people dying annually from lung cancer in the UK alone. Accurate and timely assessment of radon levels is thus important in areas with known elevated radon level risk in order to be able to institute remedial procedures. A common method for monitoring radon concentration is with small plastic detectors known as solid-state nuclear track detectors (SSNTDs). This paper reviews recent research in 3D imaging of SSNTDs using confocal microscopy.
Introduction
Inhalation of radon gas, that is 222Rn and its associated radioactive heavy metallic daughter products such as 214Po, is estimated to be associated with about 1,100 lung cancer-related deaths annually in the UK[1-3] and 21,000 in the USA[4]. Furthermore, radon exposure can increase the risk of lung cancer in smokers as well as non-smokers[5]. The gas is a natural hazard that can be found in elevated levels in areas of the UK as well overseas; it is formed as a result of the natural radioactive breakdown of uranium 238U present in rocks and soils. Radon gas is colorless and odorless, so its presence could remain undetected without the use of appropriate sensing technology. It is possible for concentrations to become unsafe, for example in poorly ventilated rooms, mines, and caves[6]. Amelioration in both homes and workplaces by adequate room ventilation measures may thus be required in order to reduce radon levels in affected areas[7]. Hence, monitoring radon concentrations in buildings is routinely undertaken in certain areas with the potential for elevated radon levels.
Measurement of radon levels in buildings is thus an important step toward tackling increased radon gas levels in rooms inhabited by humans. Solid-state nuclear track detectors (SSNTDs) are small passive devices often made of plastic that can be used to measure radon concentrations in the atmosphere. They are commonly placed in an outer enclosure that ensures air passes over the detector. Alpha particles formed by the nuclear breakdown of radon cause tiny sub-microscopic indentations, termed tracks, in the SSNTD. In order to make these visible for a light microscope, the detectors are etched. Radon gas concentration can be measured with CR‐39 plastic detectors[8], but even detectors near each other can give differing readings[6]. CR‐39 solid-state nuclear track‐etch detectors are the most commonly used for radon gas measurements.
Typically, the detectors are placed in rooms for several weeks. In order to make tracks in the SSNTD from alpha particles visible with a microscope, the tracks are enlarged using a process called etching, but this can vary in time, temperature, and etchant concentration. The standard method of assessing radon concentration involves analysis of 2D microscope images of the SSNTDs; using this approach, tracks often appear circular or elliptical in cross-section. However, distinguishing real tracks from artifacts using 2D imaging and analysis alone can be difficult.
Radon concentrations are derived from counting the number of tracks seen in SSNTDs exposed for a given period. The tracks are conventionally counted by image analysis of 2D microscope images of the detector. The length of time of the etching process can affect the size of the tracks seen[9]. This potentially could affect the counting process as short etching times could result in small tracks that may be difficult to discern, whereas long etching times could result in coalescing tracks from which it could be difficult to discern individual tracks as well as distinguishing real tracks from artifacts. Thus, etching times are important to consider as well as similarly etching temperature and pH.
Developments in microscope imaging of radon tracks
Confocal microscopy has previously been used to examine fission tracks in mica and apatite[10]. We have developed and applied methods for 3D image analysis and visualization of radon tracks in SSNTDs using confocal microscopy[9,11-14]. There can be some variation in track diameters; the results from a study indicated that the typical median (range) equivalent track diameter for single tracks is 46.1 (20.05 to 62.44) µm for standard processing[12,13]. In our studies, Olympus LEXT™ confocal microscopes have been used to image tracks, and the results have shown that tracks can have different sizes, shapes, and angles. In addition, we identified that tracks in close proximity can coalesce into a cluster; such clusters could potentially be difficult for 2D image analysis to distinguish from artifacts. 3D imaging allows a clearer distinction of real tracks from artifacts compared with 2D imaging as the full 3D extent can be ascertained from the visualization rather than just a surface image. Thus, we suggest that 3D imaging and analysis may help to improve measurement accuracy.
Comparison of 2D and 3D imaging
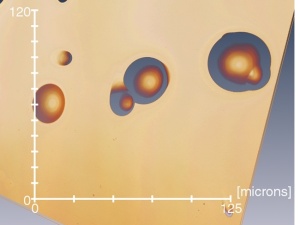
In our studies, we have used LEXT models OLS3100, OLS4000, and OLS4100 confocal laser scanning microscopes (Olympus Corporation, Tokyo, Japan) to acquire 3D image data on CR‐39 plastic detectors as previously described[9,12-14]; the detectors used were from the Radon Metrology Laboratory at Kingston University. The detectors were placed on a glass slide or directly on the microscope stage. Confocal microscope images were obtained primarily using a 50X or 100X objective mostly in fine mode; both lenses had a numerical aperture (NA) of 0.95. Examples comparing 2D imaging with 3D imaging are shown in Figures 1 to 3. Figure 1 shows an example of an artifact caused by debris on the surface that can be seen to be easily identified with 3D imaging as it lies above the surface, whereas it could potentially be confused with a small track using 2D imaging alone.
Example images
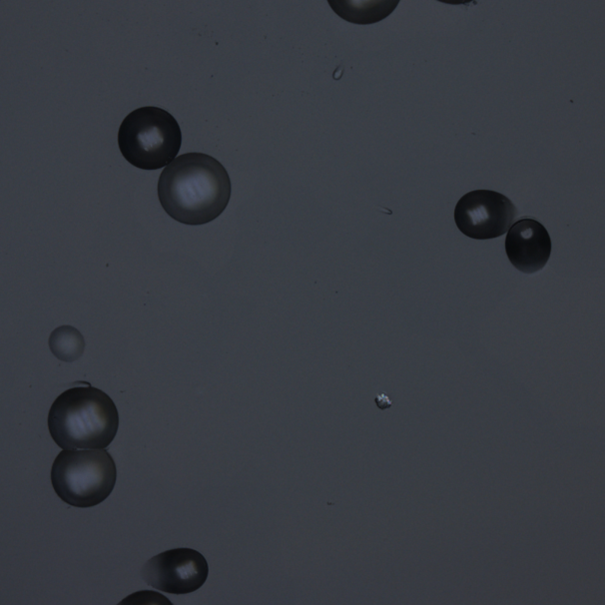
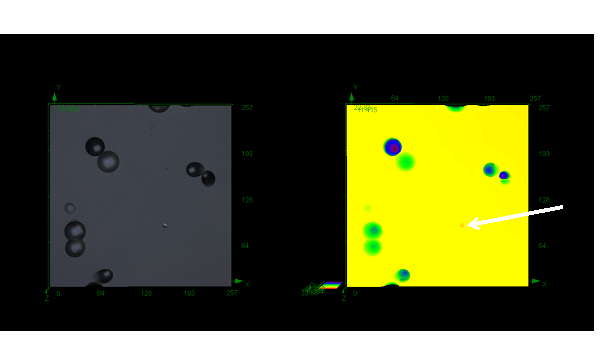
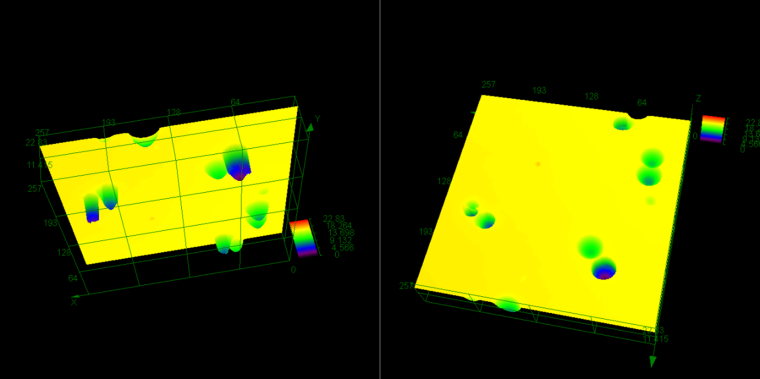
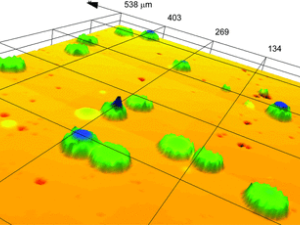
Figure 1 shows a 2D image of an SSNTD. From the image one bright area could be a small track or artifact. 3D imaging shows that it is indeed an artifact as seen in Figures 2 (right-hand image) and 3 since it emanates above the detector surface.
Depending on radon concentration and length of exposure of the detector, tracks can occur in close proximity to other tracks on the SSNTD. If tracks coalesce, it is possible that a basic 2D imaging and analysis system could have a tendency to count such multiple strikes as one or as an artifact if not of circular appearance. With longer exposures or higher radon concentrations, there is an increased likelihood that tracks could overlap or be superimposed on one another. If tracks coalesce it is possible that individual tracks may be difficult to detect using 2D image analysis, and there may thus be the potential for underassessment of track numbers; 3D imaging allows detailed examination of coalescing tracks, which could thus help in situations where SSNTDs are used over long periods or in high radon concentrations.
Our studies with the Olympus LEXT microscope have shown that confocal microscopy can be used to examine SSNTD tracks in 3D[9,12]. Suitable specimen and slide preparation are important as had helped in applying the techniques to other fields of study, such as imaging of volcanic ash particles[15].
Conclusions
Radon measurement is a key step in identifying whether levels of this colorless, odorless, radioactive gas could pose a risk to human health. A number of measurement methods are available, and one of the simplest to use is with SSNTDs. SSNTDs require no power supply and minimal maintenance and so are ideal for use around buildings as well as in remote areas. Part of our current research involves investigating if SSNTD measurement accuracy can be improved using 3D microscopy imaging compared with 2D imaging. Our results suggest that 3D imaging of radon tracks can help to enable distinguishing artifacts from real tracks; in particular 3D imaging helps to clearly identify features on the surface of the detectors that 2D imaging would not be able to easily characterize. Additionally, 3D imaging helps in the identification of multiple coalescing tracks, which are a particular issue in detectors with a high number of tracks and may have complex shapes; if the image detection is based solely on detecting round shapes, there could be a possibility for underassessment of the number of tracks. Confocal imaging enables the number of contributing tracks in coalescence to be examined closely as well as distinguishing real tracks from artifacts. Thus, 3D imaging may help in improving the accuracy of track determination in SSNTDs.
References
[1] Darby S, Hill D, Auvinen A, Barros-Dios JM, Baysson H, Bochicchio F, Deo H, Falk R, Forastiere F, Hakama M, Heid I, Kreienbrock L, Kreuzer M, Lagarde F, Mäkeläinen I, Muirhead C, Oberaigner W, Pershagen G, Ruano-Ravina A, Ruosteenoja E, Rosario AS, Tirmarche M, Tomásek L, Whitley E, Wichmann HE, Doll R. Radon in homes and risk of lung cancer: collaborative analysis of individual data from 13 European case-control studies. BMJ. 2005 Jan 29;330(7485):223. doi: 10.1136/bmj.38308.477650.63.
[2] Gray A, Read S, McGale P, Darby S. Lung cancer deaths from indoor radon and the cost effectiveness and potential of policies to reduce them. BMJ. 2009 Jan 6;338:a3110. doi: 10.1136/bmj.a3110.
[3] ICRP, 2007. The 2007 Recommendations of the International Commission on Radiological Protection. ICRP Publication 103. Ann. ICRP 37 (2-4). https://www.icrp.org/publication.asp?id=ICRP%20Publication%20103 (accessed 31st January 2022).
[4] Environmental Protection Agency (EPA), 2003. EPA Assessment of Risks from Radon in Homes. Office of Radiation and Indoor Air, United States Environmental Protection Agency, EPA Report 402-R-03-003, Washington DC, USA. https://www.epa.gov/sites/default/files/2015-05/documents/402-r-03-003.pdf (accessed 31st January 2022).
[5] Torres-Durán M, Ruano-Ravina A, Parente-Lamelas I, Leiro-Fernández V, Abal-Arca J, Montero-Martínez C, Pena-Álvarez C, González-Barcala FJ, Castro-Añón O, Golpe-Gómez A, Martínez C, Mejuto-Martí MJ, Fernández-Villar A, Barros-Dios JM. Lung cancer in never-smokers: a case-control study in a radon-prone area (Galicia, Spain). Eur Respir J. 2014 Oct;44(4):994-1001. doi: 10.1183/09031936.00017114.
[6] Cliff K, Gillmore GK. (Eds.), 2001. The Radon Manual: A Guide to the Requirements for the Detection and Measurement of Natural Radon Levels. Associated Remedial Measures and Subsequent Monitoring of Results, 3rd Edition. The Radon Council, Shepperton, Middlesex.
[7] Health and Safety Executive, 2010. Radon in the workplace, http://www.hse.gov.uk/radiation/ionising/radon.htm (accessed 31st January 2022).
[8] Phillips PS, Denman AR, Crockett RGM, Gillmore G, Groves-Kirkby CJ, Woolridge A, 2004. Comparative Analysis of Weekly vs. three monthly radon measurements in dwellings. DEFRA Report No., DEFRA/RAS/03.006.
[9] Gillmore G, Wertheim D, Crust S. Effects of etching time on alpha tracks in solid state nuclear track detectors. Sci Total Environ. 2017 Jan 1;575:905-909. doi: 10.1016/j.scitotenv.2016.09.147.
[10] Petford N, Miller JA. The study of fission tracks and other crystalline defects using confocal scanning laser microscopy. Journal of Microscopy. 1993; 170: 201–212.
[11] Petford N, Wertheim D, Miller JA. Radon track imaging in CR-39 plastic detectors using confocal scanning laser microscopy. J Microsc. 2005 Mar;217(Pt 3):179-83. doi: 10.1111/j.1365-2818.2005.01444.x.
[12] Wertheim D, Gillmore G, Brown L, Petford N. A new method of imaging particle tracks in solid state nuclear track detectors. J Microsc. 2010 Jan;237(1):1-6. doi: 10.1111/j.1365-2818.2009.03314.x.
[13] Wertheim D, Gillmore G, Brown L, Petford N. 3-D imaging of particle tracks in solid state nuclear track detectors. Natural Hazards and Earth System Sciences. 2010; 10: 1033–1036. https://doi.org/10.5194/nhess-10-1033-2010.
[14] Wertheim D, Gillmore G. Application of confocal microscopy for surface and volume imaging of solid state nuclear track detectors. J Microsc. 2014 Apr;254(1):42-46. doi: 10.1111/jmi.12114.
[15] Wertheim D, Gillmore G, Gill I, Petford N. High resolution 3D confocal microscope imaging of volcanic ash particles. Sci Total Environ. 2017 Jul 15;590-591:838-842. doi: 10.1016/j.scitotenv.2017.02.230.
Copyright:
D. Wertheim, G. Gillmore