Semiquantitative Evaluation of Secondary Carbonates via Portable X‐Ray Fluorescence Spectrometry
Secondary CaCO3 is commonly found in soils of arid and semiarid regions in variable states of development. Historically, a qualitative scale featuring various stages of development has been applied when evaluating carbonate‐laden soils. By contrast, this study used portable X‐ray fluorescence (pXRF) spectrometry to determine the Ca concentration of 75 soil samples from four US states in relation to the developmental stage, as determined independently by five pedologists from the USDA–NRCS Soil Survey Staff. Although experienced, the evaluators unanimously agreed on the carbonate development stage of only 22.6% of the samples while evaluating the samples ex situ. Portable XRF‐determined Ca content generally increased from Development Stage I through VI for intact aggregates and ground soil samples. The widest variation in Ca content was found in Stage III for both conditions. No substantive differences in Ca content were observed between Stages V and VI. A strong positive correlation was observed between the Ca content of intact aggregates vs. ground soil samples (r = 0.89). Both support vector machine classification, and interpretable rules were used to classify secondary carbonate development stages using total Ca concentrations for intact aggregates and ground soil. Using scans of both conditions offers stronger predictive ability than either condition independently. Portable XRF provides an important analytical tool for field soil scientists to evaluate soils containing Ca as part of CaCO3.
Introduction
Soils featuring secondary carbonates are common in semiarid and arid regions. CaCO3 is a mineral of limited solubility, often originally derived from the mineral calcite or Ca‐containing rocks. As mineral and rock forms of CaCO3 degrade, they can serve as parent material for various soils. For example, Alfisols, Mollisols, and Inceptisols of the Southern High Plains of Texas are largely eolian in nature, and all contain substantive subsoil secondary CaCO3, originating from the northern Chihuahuan Desert (via prevailing winds from the south). The solubility of CaCO3 is influenced by variable CO2 pressure, pH, temperature, and salinity. Often in the presence of active acidity inherited from atmospheric sources (e.g., H2CO3) or plant respiration, CaCO3 dissolves to free Ca2+ and HCO3− ions that readily translocate within the soil as part of the soil solution [1]. As water in the soil solution begins to evaporate, the solubility product is exceeded, and CaCO3 begins to precipitate, leading to the development of lower portions of the solum as Bk, Bkk, Bkkm, Ck, or, more rarely, Ak horizons. Collectively, these horizons often constitute diagnostically recognized calcic horizons [2].
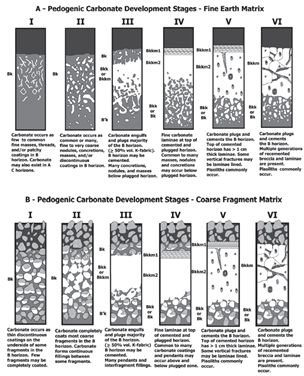
The Soil Survey Staff commonly uses morphological attributes (e.g., identifiable carbonates) and qualitative descriptions of soil horizons for establishing the quantity of secondary carbonates observed either in a fine earth or coarse fragment matrix in the field (Figure 1) [3]. Similarly, previous studies have investigated carbonates in soils, recognizing and describing up to six carbonate development stages [4–6]. Although useful, these descriptions lack the objectivity of being quantitative measures. In contrast, CaCO3 can be measured in the laboratory; however, the two most commonly applied methods—gasometry and titration—do not lend themselves easily to field quantification [7].
Register now to read the full article as well as all other premium content of Advanced Optical Metrology.
Introduction
Soils featuring secondary carbonates are common in semiarid and arid regions. CaCO3 is a mineral of limited solubility, often originally derived from the mineral calcite or Ca‐containing rocks. As mineral and rock forms of CaCO3 degrade, they can serve as parent material for various soils. For example, Alfisols, Mollisols, and Inceptisols of the Southern High Plains of Texas are largely eolian in nature, and all contain substantive subsoil secondary CaCO3, originating from the northern Chihuahuan Desert (via prevailing winds from the south). The solubility of CaCO3 is influenced by variable CO2 pressure, pH, temperature, and salinity. Often in the presence of active acidity inherited from atmospheric sources (e.g., H2CO3) or plant respiration, CaCO3 dissolves to free Ca2+ and HCO3− ions that readily translocate within the soil as part of the soil solution [1]. As water in the soil solution begins to evaporate, the solubility product is exceeded, and CaCO3 begins to precipitate, leading to the development of lower portions of the solum as Bk, Bkk, Bkkm, Ck, or, more rarely, Ak horizons. Collectively, these horizons often constitute diagnostically recognized calcic horizons [2].
The Soil Survey Staff commonly uses morphological attributes (e.g., identifiable carbonates) and qualitative descriptions of soil horizons for establishing the quantity of secondary carbonates observed either in a fine earth or coarse fragment matrix in the field (Figure 1) [3]. Similarly, previous studies have investigated carbonates in soils, recognizing and describing up to six carbonate development stages [4–6]. Although useful, these descriptions lack the objectivity of being quantitative measures. In contrast, CaCO3 can be measured in the laboratory; however, the two most commonly applied methods—gasometry and titration—do not lend themselves easily to field quantification [7].
Recently, portable X‐ray fluorescence (pXRF) spectrometry has been shown to be adept at elemental quantification in situ. For example, using reagent‐grade Ca under laboratory conditions, Zhu and Weindorf [8] found an R2 of 0.986 comparing pXRF ‐determined Ca levels with true Ca contents. The pXRF approach has also been successfully applied to enhanced pedon horizonation [9], identification of lithologic discontinuities [10], assessment of soil cation exchange capacity [11], soil pH [12], and salinity of both soil [13] and water [14]. The accuracy, speed, nondestructiveness, and inexpensiveness of pXRF offer formidable advantages over traditional laboratory‐based analytical approaches [15].
The pXRF approach cannot distinguish between the primary (rock/mineral) and secondary (Bk/Bkk) source of Ca in CaCO3-containing soil horizons as it provides only elemental data on total Ca concentration. However, the enrichment of a soil horizon with CaCO3 via pedogenesis may be assessed rapidly in situ. Such assessment is important for identifying diagnostic calcic horizons, which are defined by the CaCO3 concentration relative to adjacent horizons. We hypothesized that total Ca contents in soil aggregates may provide insight into the pedogenic development stages of secondary soil carbonates. Thus, we aimed to explore the extent to which pXRF ‐quantified Ca can explain secondary carbonate development stages.
Methods
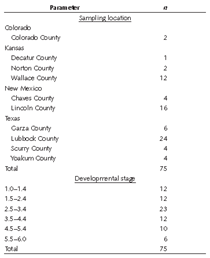
A total of 75 soil samples were collected across semiarid and arid regions of New Mexico, Texas, Colorado, and Kansas (Table 1). Sampling was done mostly in Bk, Bkk, Bkkm, and/or Ck horizons observed as road cuts. In some instances, soil pits were excavated to a depth of 1 m and then sampled. Soil sampling was done in accordance with [3], whereby subsoil aggregates were kept intact and placed in sealed plastic containers for transport to the laboratory.
Laboratory Analyses
Upon receipt in the laboratory, samples were dried as intact aggregates for 5 days at 35 °C (95 °F) until air dry as soil moisture attenuates fluorescence [9]. With Figure 1 provided as a reference, the secondary carbonate development stage of all samples was independently evaluated ex situ by five members of the USDA–NRCS Soil Survey Staff with a combined experience of 90 years. The rankings of each soil scientist were averaged to generate a mean score for each sample (Table 1). For comparative analysis, rounding of the mean score was performed to place a given sample into a class.
Ten selected soil samples were subjected to powder X‐ray diffraction for mineralogical analysis. The 10 samples represented one sample from each county in which sampling occurred, and all six developmental stages were evaluated.
Portable X-ray Fluorescence Scanning
For pXRF, samples were scanned as intact aggregates using an Olympus® DELTA™ Premium (DP‐6000) pXRF spectrometer. The spectrometer was positioned in a portable hooded test stand. Soil samples were placed on a Prolene thin film and positioned directly on the aperture of the pXRF, allowing for scanning of intact aggregates with irregular edges without exposure to stray X‐rays. For samples showing considerable heterogeneity in secondary CaCO3 distribution, the most carbonate‐laden accumulation visible in the aggregate was scanned. Scanning was conducted in Geochem mode (two beams) at 40 seconds per beam, with elemental Ca as the target element of interest. After scanning all intact aggregates, samples were ground and rescanned as powders. Instrument performance was verified via the scanning of two NIST‐certified reference soils.
Support vector machine (SVM) classification was implemented for statistical analysis to classify secondary carbonate development stages using total Ca concentrations in intact aggregates (Ca-intact) and ground soil (Ca-ground) samples. Radial kernel SVM was used, incorporating Ca‐intact, Ca‐ground, and Ca‐intact + Ca‐ground as explanatory variables. Tenfold cross‐validation was used to select the optimal tuning parameters in SVM (cost and kernel width). The full article of this digest includes a more detailed description of the SVM approach.
Results and Discussion
Qualitative assessment of the secondary carbonate development stage showed considerable disagreement among the panel of evaluators. Unanimous agreement was found on only 16 samples (22.6%). Fair agreement was defined by one or more panelist(s) placing a given sample in adjacent carbonate development stages. Poor agreement was defined by panelists placing a given sample in three adjacent development stages. Fair and poor agreement among panelists was observed for 46 (61.3%) and 12 (16%) samples, respectively.
X‐ray diffraction generally revealed a larger diversity in mineralogy and lower total Ca content at lower developmental stages. As the carbonate development stage increased, the mineralogy became increasingly dominated by CaCO3 and SiO2. For example, a Stage III sample from Lincoln County, New Mexico, featured 42.6% CaCO3 and 33.9% SiO2 and included smaller quantities of phengite, anorthite, birnessite, and vermiculite. By contrast, a Stage VI sample from Lubbock County, Texas, featured 94.3% CaCO3 and 5.7% SiO2; no other minerals were identified.
Field‐intact aggregate scans of soil Ca via pXRF showed clear differences between samples classified as carbonate development Stages I–V, with less difference between Stages V and VI (Figure 2). Importantly, pXRF reports only total soil Ca content, so it cannot distinguish between primary and secondary CaCO3 or determine the degree of induration. Careful attention must be given to field‐intact soil aggregates because secondary carbonate precipitation is often influenced by the wetting front, soil structure, and soil porosity [4]. For example, it is quite common to find secondary carbonates deposited on the face of structural aggregates while the matrix remains carbonate-free [16]. Thus, scanning the carbonate‐laded prism face may cause an overestimation of the carbonate development stage relative to the overall soil volume. However, scanning soils both as intact aggregates and <2‐mm powders provides an important differential measure that can be used for carbonate stage assessment (Table 2).
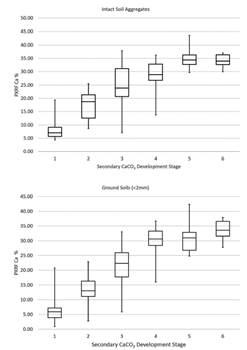
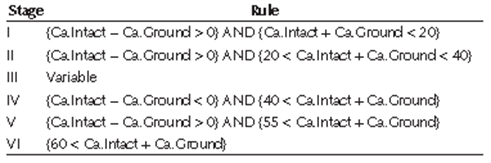
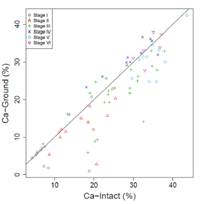
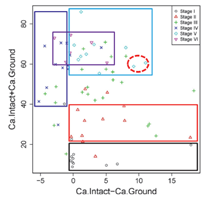
Pearson correlation testing exhibited a high positive correlation between Ca‐intact and Ca‐ground (r = 0.89, Figure 3). Moreover, Figure 4 shows the basis for some interpretable rules (Table 2) that were devised for explaining different secondary carbonate development stages using Ca‐intact and Ca‐ground values. A box was used to identify each stage in the scatterplot. This was motivated by the fact that each box can be expressed by "IF AND THEN" language, with intervals on each variable. For example, Stage I's box can be expressed as IF (Ca‐intact − Ca‐ground is >0) AND (Ca‐intact + Ca‐ground is <20), THEN the sample is most likely to be Stage I (Figure 4 and Table 2). Stage I was the easiest to identify, whereas Stage III was the most variable; these results are consistent with the variability observed in Ca content (Figure 2). Conversely, Stages IV–VI appeared very close (Figures 2 and 4). Notably, although Stages IV and V were very close to each other, Stage IV was above the y = x line (Figure 3), indicating Ca‐ground > Ca‐intact, whereas the opposite trend was observed in Stage V. These trends indicate the benefit of using both pXRF‐sensed variables in classifying carbonate developmental stages. The results further indicate that pXRF scanning can be used to identify several carbonate developmental stages. Based on our results and the original concepts [3], revision to the carbonate development stages may be warranted. For example, Stages V and VI may be combined into a single developmental stage because their Ca content and morphological features were generally similar.
Using Ca‐intact + Ca‐ground, SVM achieved the lowest 10‐fold cross‐validation error (0.491). Conversely, while using Ca‐intact and Ca‐ground independently, SVM achieved 0.521 and 0.527 cross‐validation errors, respectively. Hence, using two variables together provides better results than either variable alone. Notably, 83.3% (n = 10), 83.3% (n = 10), 91.03% (n = 21), 91.66% (n = 11), 60% (n = 6), and 33.33% (n = 2) of the samples were correctly classified for Stages I, II, III, IV, V, and VI, respectively. Figure 5 shows the resultant nonlinear SVM classification plot. The region outside the data range is the extrapolation area, which is useless and artificial (e.g., yellow region in the top left corner). The plot indicates that Stage III (yellow region) had the largest area within the data range, indicating the largest variation for Ca‐intact and Ca‐ground. Further, the Stage I region (dark green) was mainly located at the lower-left corner, indicating that Stage I samples had the smallest Ca‐intact and Ca‐ground values. The Stage II region (green) is next to Stage I, confirming that samples from both groups were relatively close together. The Stage VI region (white) implies that Stage VI samples had the largest value in both variables. The narrow nature of the diagonal Stage V region can be attributed to the two samples from Stage V, which were close to the diagonal area (red circle in Figure 4). Further, Stages IV, V, and VI were relatively close to each other, exhibiting larger Ca‐intact and Ca‐ground values than Stages I and II (Figures 2 and 4). However, Stage IV and V were separated by the diagonal lines, implying that Stage IV samples had larger Ca‐ground values than Ca‐intact, whereas Stage V samples showed the opposite trend. Therefore, it can be concluded that Stages I and II were relatively easy to identify.
Conclusion
In summary, 75 carbonate‐laden soils were subjected to pXRF scanning to provide semiquantitative information on the carbonate development stage. The results indicate that Ca concentration increases steadily with the carbonate development stage. This was true for both intact aggregates and ground powder samples. Stage III carbonate development demonstrated the widest variability in Ca content. Intact aggregates showed almost no difference in Ca content between Stages V and VI. SVM analysis realistically classified carbonate development stages using total Ca concentrations in intact aggregates and ground soil samples. Portable XRF was generally shown to be a useful tool in establishing the developmental stage of secondary carbonates in soils.
Original Article:
Chakraborty, S., Weindorf, D.C., Weindorf, C.A., Das, B.S., Li, B., Duda, B., Pennington, S. and Ortiz, R. (2017), Semiquantitative Evaluation of Secondary Carbonates via Portable X-ray Fluorescence Spectrometry. Soil Science Society of America Journal, 81: 844-852. https://doi.org/10.2136/sssaj2017.01.0019
References
[1] C. C. Reeves, J. Geol. 1970, 78, 352.
[2] Soil Survey Staff, in Keys to soil taxonomy, Natl. Soil Surv. Ctr., Lincoln, 2014.
[3] P. J. Schoeneberger, D. A. Wysocki, E. C. Benham, E.C., in Field book for describing and sampling soils, Natl. Soil Surv. Ctr., Lincoln, NE, 2012.
[4] H. W. Hawker, Soil Sci. 1927, 23, 475.
[5] M. N. Machette, in Calcic soils of the southwestern United States, Geol. Soc. Am., Boulder, 1985.
[6] A. M. Alonso‐Zarza, P. G. Silva, J. L. Goy, C. Zazo, Geomorphology 1998, 24, 147.
[7] R. H. Loeppert, D. L. Suarez, in Methods of soil analysis. Part 3—Chemical methods, SSSA and ASA, Madison, 1996.
[8] Y. Zhu, D. C. Weindorf, Soil Sci. 2009, 174, 151.
[9] D. C. Weindorf, Y. Zhu, B. Haggard, J. Lofton, S. Chakraborty, N. Bakr, W. T. Zhang, W. C. Weindorf, M. Legoria, Soil Sci. Soc. Am. J. 2012, 76, 522,
[10] D. C. Weindorf, S. Chakraborty, A. A. A. Aldabaa, L. Paulette, G. Corti, S. Cocco, E. Micheli, D. Wang, B. Li, T. Man, A. Sharma, T. Person, Soil Sci. Soc. Am. J. 79, 1704.
[11] A. Sharma, D. C. Weindorf, D.D. Wang, S. Chakraborty, Geoderma 2015, 239–240, 130.
[12] A. Sharma, D. C. Weindorf, T. Man, A. A. A. Aldabaa, S. Chakraborty, Geoderma 2014, 232–234, 141.
[13] S. Swanhart, D. C. Weindorf, S. Chakraborty, N. Bakr, Y. Zhu, C. Nelson, K. Shook, A. Acree, Soil Sci. 2014, 179, 417.
[14] D. Pearson, S. Chakraborty, B. Duda, B.Li, D. C. Weindorf, S. Deb, E. Brevik, D. P. Ray, J. Hydrol. 2017, 544, 172.
[15] D. C. Weindorf, N. Bakr, Y. Zhu, Adv. Agron. 2014, 128, 1.
[16] R. J. Schaetzl, S. Anderson, in Soils: Genesis and geomorphology, Cambridge Univ. Press, New York, 2005.
Source: Preview Image: MarcelClemens/Shutterstock