Impact of Sample Preparation Methods for Characterizing the Geochemistry of Soils and Sediments by Portable X‐Ray Fluorescence
We examined the impact of three different sample preparation methods on bulk soil geochemistry data obtained from a portable X‐ray fluorescence (pXRF) spectrometer. We generated data from a soil core recovered from the surface, downward into unaltered loess, and into a buried soil at a site in eastern Iowa. Samples were scanned (i) directly from field‐moist soil cores; (ii) after drying, grinding, and being loosely massed in plastic cups; and (iii) as pressed powder pellets. Data derived using these methods were compared with data obtained from a standard benchtop X‐ray fluorescence (XRF) unit. Generally, the results indicated that data from pressed powder pellets provide the best correlation to benchtop XRF data, although the results were sometimes element- or compound-specific. CaO, Fe2O3, and K2O generally provided the strongest correlations between pXRF and XRF data; SiO2 data were more problematic. Field‐moist pXRF scans generally underestimated element concentrations, but the correlations between pXRF and benchtop XRF measurements were greatly improved after applying pXRF‐derived calibration standards. In summary, although element/compound data provided by pXRF showed significant relationships to benchtop XRF data, the results are improved with proper sample preparation and usually by calibrating the pXRF data against known standards.
Introduction
X‐ray fluorescence (XRF) spectroscopy is an analytical technique used to determine the elemental composition of a sample using high‐energy X‐rays. When bombarded with X‐rays, different elements can be identified by the characteristic fluorescent energy they emit (X‐ray fluorescence). Thus, X‐ray fluorescence offers a rapid and cost‐efficient way to generate multielement analytical data.
Researchers are increasingly using portable X‐ray fluorescence (pXRF) instruments in the field and laboratory [1]. Many studies have demonstrated that pXRF measurements correlate well with data obtained using conventional methods, such as benchtop XRF [2]. Portable XRF instruments can generate robust, accurate, and repeatable data and are applicable to various environmental applications [3].
As with any new method, researchers actively attempt to determine its overall accuracy and main error sources. Unfortunately, no universally agreed‐upon protocol for pXRF sample preparation exists, specifically for analyses of soils or finely ground geological samples. Nonetheless, the Soil Survey Staff [4] has observed that the results from soil analyses are more reproducible if the sample has been air dried, homogenized, and finely ground (<75 µm). By comparison, the Soil Science Society of America method for pXRF analysis of soils advocates drying and grinding to pass a 2 mm sieve [5]. The present study addresses this issue by evaluating the effects of different sample preparation techniques on pXRF data.
Register now to read the full article as well as all other premium content of Advanced Optical Metrology.
Introduction
X‐ray fluorescence (XRF) spectroscopy is an analytical technique used to determine the elemental composition of a sample using high‐energy X‐rays. When bombarded with X‐rays, different elements can be identified by the characteristic fluorescent energy they emit (X‐ray fluorescence). Thus, X‐ray fluorescence offers a rapid and cost‐efficient way to generate multielement analytical data.
Researchers are increasingly using portable X‐ray fluorescence (pXRF) instruments in the field and laboratory [1]. Many studies have demonstrated that pXRF measurements correlate well with data obtained using conventional methods, such as benchtop XRF [2]. Portable XRF instruments can generate robust, accurate, and repeatable data and are applicable to various environmental applications [3].
As with any new method, researchers actively attempt to determine its overall accuracy and main error sources. Unfortunately, no universally agreed‐upon protocol for pXRF sample preparation exists, specifically for analyses of soils or finely ground geological samples. Nonetheless, the Soil Survey Staff [4] has observed that the results from soil analyses are more reproducible if the sample has been air dried, homogenized, and finely ground (<75 µm). By comparison, the Soil Science Society of America method for pXRF analysis of soils advocates drying and grinding to pass a 2 mm sieve [5]. The present study addresses this issue by evaluating the effects of different sample preparation techniques on pXRF data.
For soil investigations, some studies have obtained data by placing the instrument directly onto a field‐moist core [6]. Moisture in the sample attenuates the fluorescence, usually leading to underestimation of elemental data [7]. However, moisture levels of <20% generally cause a minimal error in elemental determinations [8]. For example, Stockmann et al. [6] calculated geochemical weathering indices using elemental pXRF data. Although the indices varied greatly between field‐moist vs. dried samples, the depth trends showed similar patterns.
Although the accuracy of pXRF measurements from field‐moist samples continues to be explored, most researchers conduct their analyses in a laboratory setting. Laboratory preparations typically involve combinations of drying, sieving, and grinding the samples before pXRF analysis [9]. Other researchers physically compact each sample in a standard‐sized container, forming a pressed powder pellet, before analysis.
Few studies have examined the efficacy of various sample pretreatments on the overall accuracy of the data. The objective of this study was to examine the effects of three different preparation methods on pXRF data from three soil samples: (i) field‐moist soils, (ii) dried and ground powders, and (iii) pressed pellets. Data generated using these preparation methods were compared with traditional benchtop XRF data to determine the effects of sample pretreatment on final data accuracy.
Methods
Samples from Clear Creek, a tributary of the Iowa River in eastern Iowa, were selected for the study. The Clear Creek Watershed is located within the Southern Iowa Drift Plain [10] and represents a hilly, dissected landscape underlain by Pre‐Illinoian tills, with a mantle of loess. At the site, a 7.6 cm diameter core (5.0 m in length) was collected from a site on an upper shoulder slope. A detailed description of the study area and soil is present in the full article of this digest.
Three different pXRF preparation methods (field‐moist condition, dried and ground to a powder, and pressed pellets) were compared to evaluate their efficacy for accurately determining soil/sediment geochemistry and weathering zones for the cores. A benchtop XRF unit was used as a comparative standard to establish the bulk chemical composition of the samples. Samples analyzed on the benchtop XRF had been initially removed from the scraped surfaces of the cores, dried at 50 °C (122 °F) for 12 hours, and ground to a fine powder. Subsamples of ∼0.2–0.5 g were further ground to pass a 75 µm sieve, pressed into pellets, and made into homogeneous glass disks by fusion of the sample and a lithium tetraborate/lithium metaborate mixture [11]. XRF analyses were conducted for seven elements (Si, Al, Zr, K, Ca, Ti, Fe, and Mn) at SGS Canada Inc., in Mississauga, Ontario. Quality control was achieved using SiO2 blanks, duplicates, and certified reference materials [11].
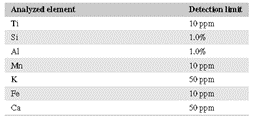
Portable XRF analyses were performed in Geochem Mode using an Olympus® DELTA™ Professional pXRF unit. The unit was operated on line at 110 VAC, without special filters, with a dwell time of 30 seconds, and under normal atmospheric conditions. Instrument resolution was 150 eV per channel with a pulse density of 100,000 cps. Resulting waveforms were processed with the proprietary Olympus X‐act Count Digital Pulse Processor and integrated software [12]. Each time the pXRF was initialized, a 316 alloy coin was used for factory calibration. Detection limits for pXRF analyses vary by element (Table 1).
Initial scanning was completed by placing the pXRF device directly on the moist core at ≤10 cm intervals after any outer sediment material had been scraped away and the exterior area flattened with a knife. If a horizon break occurred, the sample increment was lessened so that no sample was taken from different horizon types. The remainder of the analyses were conducted on dried samples. In the laboratory, ∼100 g samples were ground. Subsamples of ∼20 g were then powdered, placed in 2.5 cm diameter plastic cups with at least 2 cm of material, covered with a 3.0 µm thin mylar film, and lightly tamped to achieve a level surface before pXRF analysis. Portable XRF analyses were also conducted on pucks formed by compressing the sediment in 0.4 × 3 cm stainless steel cups using a stainless steel hydraulic press at 25 tons of pressure per square inch (pressed powder pellets). Four replicate scans were conducted on each sample for each method; all data reported are mean elemental data. Portable XRF data were converted to oxide values using standard conversion factors for SiO2, Al2O3, K2O, CaO, TiO2, Fe2O3, and MnO. Four soil standard reference materials from the National Institute of Standards and Technology (NIST; https://www.nist.gov/srm; AGV‐2, BIR‐1, BCR‐2, JA‐1) were examined to develop linear calibration curves for selected elements/oxides using the Lucas‐Tooth Calibration Method [13]. The average value of each standard, based on five analyses, was then compared with the known values reported by Jochum et al. [14]. An in‐house standard of Peoria loess, which was geochemically similar to the core materials, was used as a fifth standard.
Results and Discussion
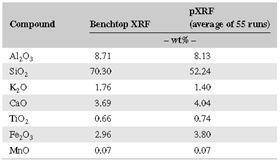
Data derived from pXRF and benchtop XRF were often quite different; SiO2 and Fe2O3 data were especially problematic (Table 2). Using three different sample preparation methods (moist core, dried and ground powder, and a pressed powder pellet), we sought to understand which method yields the most accurate pXRF results relative to data from the traditional benchtop XRF instrument. We assumed that benchtop XRF data most accurately characterize the overall bulk chemical composition of the soils. Benchtop XRF data may still suffer from overlapping fluorescence energies of different elements, limiting data interpretability. Furthermore, “light” elemental detection remains challenging given their weak fluorescent energies and atmospheric attenuation issues.
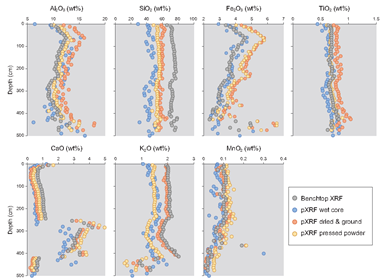
To that end, pXRF data from three different pretreatments were compared with benchtop XRF data. Example data from the Old Scotch core are shown in Figure 1. Generally, CaO, TiO2, and MnO data from the pXRF correlated best with benchtop XRF data, and for these compounds, the correlations were strongest when using the pressed powder method. Nonetheless, many of the data are element-specific, and thus the optimal sample preparation method is not the same for the seven elements/compounds. Portable XRF routinely overestimated the contents of Fe2O3 and Al2O3 and generally underestimated those of CaO and K2O (Figure 1). Several researchers have reported a tendency of pXRF to overestimate Fe concentrations [15], a trend observed in the present study on all but the wet core samples (Figure 1). A possible explanation for the latter is that many closely spaced K‐ and L‐lines occur in the low‐energy region, causing spectral interferences [16]; however, as moisture attenuates fluorescence, that attenuation probably compensated for the overestimation of Fe in the present study. Generally, the accuracy of the data increased for most elements using the pressed powder pellet method. Thus, these data will be used as the pXRF component from this point forward.
Correlations of (pressed powder) pXRF vs. benchtop XRF data indicate that the highest R2 values were obtained for CaO (0.997), Fe2O3 (0.983), and K2O (0.981); analyses for Al2O3 (0.746), TiO2 (0.666), and SiO2 (0.136) yielded lower correlations. Low correlation values for SiO2 probably reflect variable attenuation of low‐frequency X‐rays during pXRF analysis, whereas the slightly lower correlation values for TiO2 might reflect an uneven distribution of Fe‐Ti oxides in the samples because of their overall lower concentrations.
Linear calibrations were developed for elements that appeared to vary consistently between benchtop XRF and pXRF analyses using four NIST standards and the in‐house Peoria Loess standard (Figure 2). The linear regressions were then used to correct (calibrate) the pXRF data. Based on the standards shown in Figure 2, these calibrations are for major oxides: CaO, MnO, MgO, Fe2O3, P2O5, K2O, and TiO2. They produced well‐correlated calibrations. Except for SiO2, the correlation coefficients are >0.7, with most being >0.9.
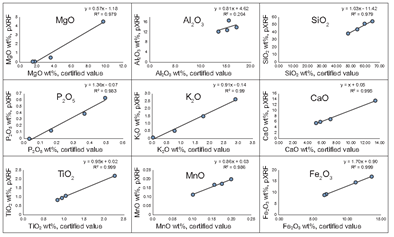
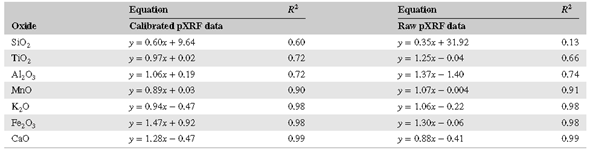
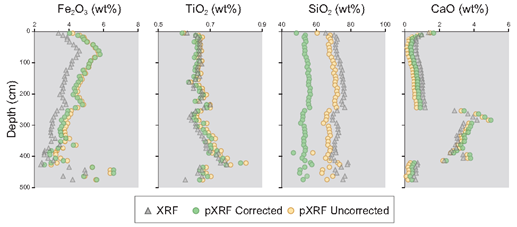
Table 3 illustrates the improvements in correlation between the uncalibrated vs. calibrated pXRF data of the samples. Although most of the data were improved using the calibration functions, data for some elements were only slightly improved or even slightly worsened. Despite producing substantial improvement in R2 values for SiO2 by pXRF correction, the concordance between benchtop XRF and calibrated pXRF SiO2 data was still moderate at best (R2 = 0.60). Figure 3 shows the changes in the data for four elements obtained by applying the calibrations in Figure 2 to the raw pXRF data.
Results indicate that the overall accuracy of the Olympus® pXRF data is very good but somewhat element-dependent. For example, the comparatively poor performance of some elements may create problems for determining weathering ratios, many of which are dependent on Al or Si oxide contents and often use Ti as an indicator of the contents of the slowly weatherable mineral tourmaline [17]. Likely, the contents of light elements such as Mg, Al, and Si are more difficult to determine accurately because the emitted X‐rays are more easily attenuated by the atmosphere. As a result, these elements have lower R2 values and poorer calibrations due to the low‐energy condition and the inability of the current pXRF technology to properly correct this issue (Table 3).
The accuracy of raw pXRF data can be improved for most oxides by calibrations. Such linear calibrations should ideally have a slope of 1.0 and an intercept at the origin. The calibrations in this study differ significantly from these values, likely reflecting the inaccuracy of the internal calibration technique of the Olympus® instrument and issues related to X‐ray attenuation, fluorescence, and interference. Thus, many pXRF data may have good correlations but are offset by XRF data derived from benchtop instruments (Figure 1). Improvements in these calibrations could be achieved using more standards and standards with higher variability in composition. Particularly concerning is that applying calibrations to known standards did not improve the Si data (Figure 3).
The intensity of characteristic fluorescence decreases with increasing soil moisture due to strong X‐ray absorption by soil water [5]. Therefore, dried, ground, and sieved soil samples should theoretically provide increased homogeneity by averaging out the effect of microscale inclusions and similar substances, such as Fe/Mn concretions. However, compression of dried/ground powders may also artificially inflate pXRF elemental readings by accentuating the number of atoms per unit area in contact with the X‐ray beam. Indeed, the average bulk density of the pressed powder pellets was significantly higher (2.56 g cm−3) than the average bulk density of the cores (1.69 g cm−3).
Conclusion
In this study, soil/sediment samples from cores taken in loess soils in eastern Iowa were evaluated by pXRF spectrometry using three different pretreatments: (i) field‐moist soils (no pretreatment), (ii) dried/ground powder, and (iii) pressed powder pellets. Results from the pXRF were compared with benchtop XRF data. Portable XRF data from pressed powder pellets performed best for certain elements/oxides and generally provided the strongest correlations between pXRF and XRF data. Data correlations for some other elements were less robust. Scanning of field‐moist samples consistently underestimated the concentrations of certain elements/oxides due to fluorescence attenuation. Therefore, soil samples should be dried, ground, sieved, and, in some cases, pressed into dense pellets before pXRF analysis.
Application of calibrations developed from standard materials to adjust pXRF data resulted in considerable improvements, leading to data that more closely align with benchtop XRF data. However, more work is needed to simultaneously consider the influence of moisture, sample bulk density, pXRF operational parameterization, and correction of reported pXRF data with local calibration samples. Those limitations notwithstanding, pXRF remains a powerful tool for rapid in situ analysis of soils and ground geologic sediments.
Original Article:
Goff, K, Schaetzl, RJ, Chakraborty, S, Weindorf, DC, Kasmerchak, C, Bettis, EA III. Impact of sample preparation methods for characterizing the geochemistry of soils and sediments by portable X-ray fluorescence. Soil Sci. Soc. Am. J. 2020; 84: 131– 143. https://doi.org/10.1002/saj2.20004
References
[1] S. Chakraborty, B. Li, D. C. Weindorf, S. Deb, A. Acree, P. De, P. Panda, Geoderma 2019, 338, 5.
[2] A. M. W. Hunt, R. J. Speakman, J. Archaeol. Sci. 2015, 53, 626.
[3] D. C. Weindorf, N. Bakr, Y. Zhu, Adv. Agron. 2014, 128, 1.
[4] Soil Survey Staff, in Kellogg soil survey laboratory methods manual, Natl. Soil Surv. Ctr., Lincoln, 2014.
[5] D. C. Weindorf, S. Chakraborty, Soil Sci Soc Am J. 2020, 84, 1384.
[6] U. Stockmann, S. R. Cattle, B. Minasny, A. B. McBratney, Catena 2016, 139, 220.
[7] H. Sahraoui, M. Hachicha, J. Fundam. Appl. Sci. 2017, 9, 468.
[8] USEPA, Method 6200: Field portable X‐ray fluorescence spectrometry for the determination of elemental concentrations in soil and sediment, 2007, www.epa.gov.
[9] B. M. Duda, D. C. Weindorf, S. Chakraborty, B. Li, T. Man, L. Paulette, S. Deb, Geoderma 2017, 298, 78.
[10] J. C. Prior, in Landforms of Iowa. University of Iowa Press, Iowa City, 1991.
[11] SGS Canada Inc., Sample preparation and XRF procedure, Mississauga, 2016.
[12] Olympus Corporation, XRF and XRD Analyzers DELTA Premium, Tokyo, 2017.
[13] M. J. Adams, J. R. Allen, J. Anal. At. Spectrom. 1998, 13, 119.
[14] K. P. Jochum, U. Nohl, K. Herwig, E. Lammel, B. Stoll, A. W. Hofmann, Geostand. Geoanal. Res. 2005, 29, 333.
[15] J. Koch, S. Chakraborty, N. Li, J. Moore‐Kucera, P. Van Deventer, A. Daniell, C. Faul, T. Man, D. Pearson, B. Duda, C. A. Weindorf, D. C. Weindorf, J. Geochem. Explor. 2017, 181, 45.
[16] D. Gallhofer, B. G. Lottermoser, Minerals 2018, 8, 320.
[17] B. Buggle, B. Glaser, U. Hambach, N. Gerasimenko, S. Markovic, Quat. Int. 2011, 240, 12.
Source: Preview Image: Artography/Shutterstock