Metal Friction and Wear Reduction: Effect of Graphene
An internal mixer is one the most common types of rubber-mixing equipment. This device can operate continuously for a long time, and often develops wear on its end face. The end face wear increases the gap between the mixing chamber and the end face, resulting in material leakage, which reduces the mixing effect and impacts the properties of the compound. Therefore, it is important to study the friction and wear of the mixing compound to the metal during the mixing process. In the present study, the influence of the mixing compound with different amounts of graphene (GE) on the friction and wear of the metal end face was analyzed, and the ratio of the corrosion wear to abrasive wear was calculated for the first time.
1. INTRODUCTION
Rubber has an undeniable role in the economy since it has been widely applied to numerous high-tech and modern technologies. However, raw rubber has low strength, low modulus, poor wear resistance, and fatigue resistance so that it cannot be used in most engineering applications. Accordingly, it is necessary to fill and reinforce the vast majority of rubbers with, for example, carbon black (CB) and silica (SiO2). However, macromolecular chains form in the packing due to the sticky nature of rubber materials and elastic hysteresis loss inside the rubber packing, thereby producing friction loss and generating considerable heat. Efficiently dissipating the generated heat to the outside leads to internal spirals in the rubber and degrades its performance. Therefore, it is important to improve the thermal conductivity of rubber products to improve their performance and service life under dynamic use. With the diversification of rubber products, many applications need rubber products with antistatic properties, reasonable electrical conductivity, or a gas barrier. Recent investigations have revealed that adding small amounts of nanofillers, such as clay, carbon nanotubes (CNTs), and graphene to the rubber composite can improve the thermal conductivity, enhance the heat dissipation capacity, and improve the reinforcement efficiency and functional properties of the final product.
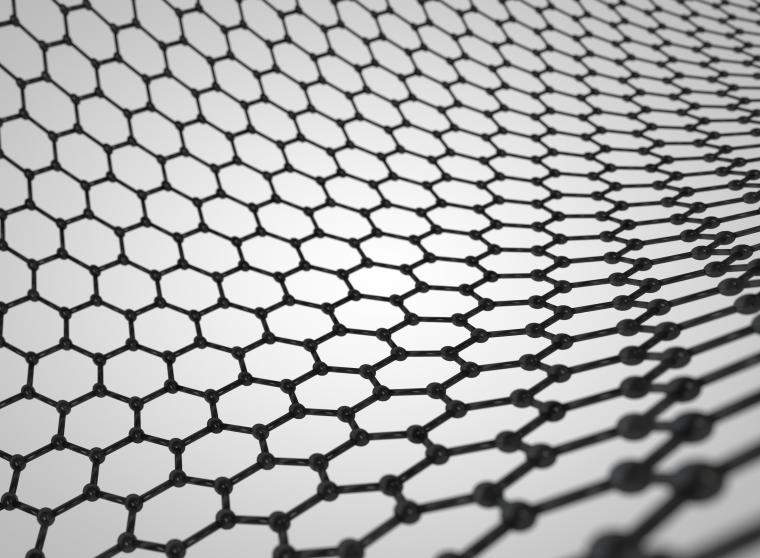
Graphene (GE) is a two-dimensional (2D) crystal with a single atomic layer formed by sp2 hybridization of carbon atoms arranged neatly in cellular lattice structural units. GE is one of the strongest substances known so far, and it is highly ductile and flexible. Figure 1 shows the schematic structure of GE.
Introduction
Rubber has an undeniable role in the economy since it has been widely applied to numerous high-tech and modern technologies. However, raw rubber has low strength, low modulus, poor wear resistance, and fatigue resistance so that it cannot be used in most engineering applications. Accordingly, it is necessary to fill and reinforce the vast majority of rubbers with, for example, carbon black (CB) and silica (SiO2). However, macromolecular chains form in the packing due to the sticky nature of rubber materials and elastic hysteresis loss inside the rubber packing, thereby producing friction loss and generating considerable heat. Efficiently dissipating the generated heat to the outside leads to internal spirals in the rubber and degrades its performance. Therefore, it is important to improve the thermal conductivity of rubber products to improve their performance and service life under dynamic use. With the diversification of rubber products, many applications need rubber products with antistatic properties, reasonable electrical conductivity, or a gas barrier. Recent investigations have revealed that adding small amounts of nanofillers, such as clay, carbon nanotubes (CNTs), and graphene to the rubber composite can improve the thermal conductivity, enhance the heat dissipation capacity, and improve the reinforcement efficiency and functional properties of the final product.
Graphene (GE) is a two-dimensional (2D) crystal with a single atomic layer formed by sp2 hybridization of carbon atoms arranged neatly in cellular lattice structural units. GE is one of the strongest substances known so far, and it is highly ductile and flexible. Figure 1 shows the schematic structure of GE.
Yong Lin[1] studied the filler–rubber interface interaction in GE/silicon dioxide hybrid styrene–butadiene rubber composites and quantified the number of confinement regions. It was found that the larger the volume fraction of the constraint region, the stronger the interfacial interaction. Moreover, experiments and numerical simulations showed that the higher the volume fraction of the confinement zone, the better the mechanical properties of the composites.
Xumin Zhang[2] studied the thermal conductivity, expansion, and mechanical properties of PrGO/natural rubber (NR) nanocomposites. It was found that as the amount of PrGO in the composite increases, the thermal conductivity and energy storage modulus of PrGO/NR nanocomposite increases, while solvent absorption decreases. Moreover, adding 3 phr of PrGO increases the tensile strength and tear strength of nano-NR composites by 23% and 150%, respectively.
Hong Zhu[3] studied the effect of GE/silicon dioxide nanocomposites on the properties of SSBR/BR. It was found that adding reduced graphene oxide (rGO) improves the mechanical properties of SSBR/BR.
Yanping Wu[4] studied the mechanical and tribological properties of GE-reinforced rubber composites. The results showed that the mechanical properties of SSBR–BR composite filled with FGS were substantially better than those of the unfilled and equivalent filler-loaded graphene oxide (GO) and rGO-filled SSBR–BR composites. Moreover, it was found that the addition of GO, rGO, and FGS decreases the wear resistance of SSBR-BR composites.
GE/rubber composites have become a hot topic in the rubber field in recent years.[5–11] In this article, the effect of adding different amounts of GE on the friction and wear of the end face metal during the mixing process was studied.
Experiments
2.1 Instruments
Hake internal mixer, BL-6157 Double Roll Mill, ZT-2588S steam generator, RPA 2000 Rubber Processing Performance Analyzer, DisperGRADER Dispersion Meter, LEXT OLS5000 3D laser measuring microscope (Olympus Japan), CSM-Friction and Wear Tester.
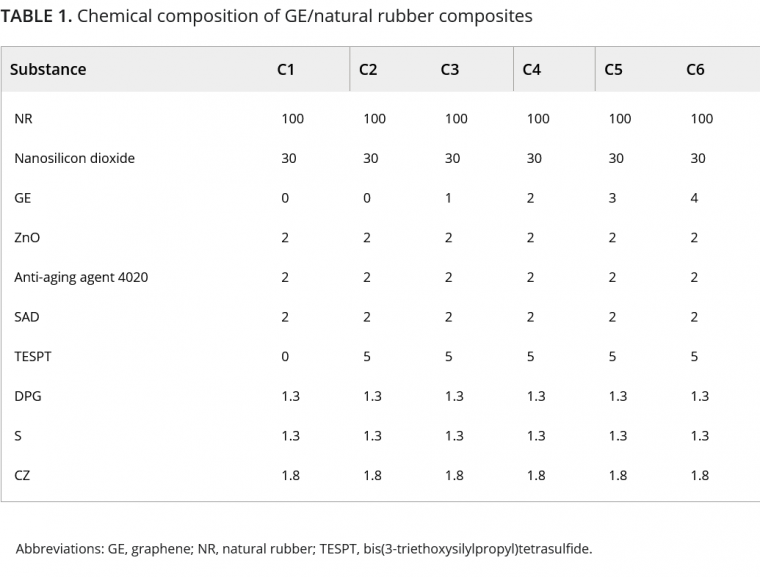
2.2 Formula
The formula is shown in Table 1.
2.3 Mixing process
In order to ensure the accuracy of the experiment, the test sample was made by pressing through a double-roller mill. To ensure the smoothness of rubber samples, samples pressurized by the double roller mill were put into the grinding tool to obtain a smooth surface and reduce the influence of surface roughness on the friction coefficient.
2.4 Test methods
1. The Panye effect[12-13] refers to the phenomenon that the dynamic modulus of filled rubber decreases sharply with the increase of strain. This phenomenon is usually used to reflect the dispersion of packing. The deformation of six rubber compounds was scanned by a rubber analyzer, and the distribution of dynamic modulus G0 changing against strain was obtained.
2. The Silanization reaction index is an important to measure the degree of silane modification of silica. A rubber processing analyzer was used to test the silylation reaction index. The greater the silanization reaction index, the higher the degree of silanization reaction, and the better the overall properties of the rubber compound.
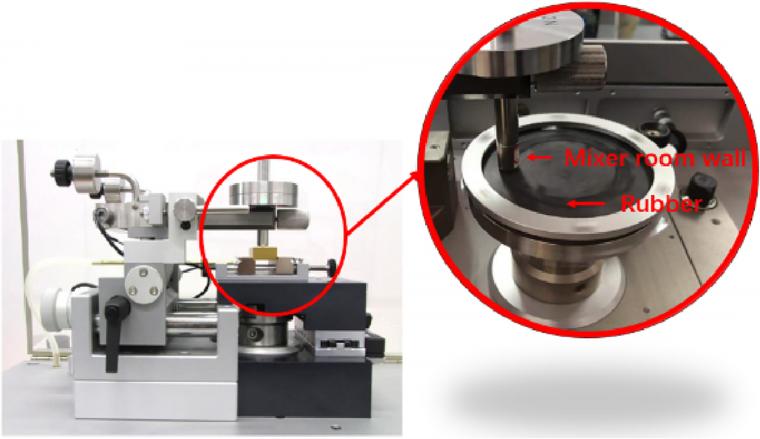
3. Friction and wear testing was carried out using a CSM. To this end, the experimental pressure, rotational speed, and the test time were set to 5 N, 70 rpm, and 120 min, respectively. In order to study the wear condition of the internal mixer end face, the same metal grinding head material and end face material were used in the experiment. To ensure complete silanization, the mixing temperature was kept at 145–155 ⁰C (293–311 °F) for 1 min. The temperature of CSM was set to 150 ⁰C (302 °F) to ensure the reliability of the experiment. CSM is shown in Figure 3.
4. 3D morphology observation: The metal surface morphology was observed by using a 3D laser measuring microscope (OLS5000, LEXT, Olympus), where the wear amount was obtained by measuring the volume reduction of the metal grinding head.
5. Dispersion test: A carbon black dispersion tester was used to test the degree of dispersion and obtain the dispersion value based on the ASTM D7723 standard (Figure 2).
Silanization Reaction Mechanism
Bis(3-triethoxysilylpropyl)tetrasulfide (TESPT) is a bifunctional silane coupling agent. Arkles[14] proposed a four-step reaction model based on the coupling process of TESPT:
1. Three Si-OR groups connected with silicon are hydrolyzed to Si OH;
2. Si-OH is dehydrated and condensed into oligosiloxane containing Si OH;
3. Si-OH in the oligomer forms a hydrogen bond with OH on the substrate surface;
4. A covalent bond is formed with the substrate along the dehydration reaction in the heating curing process, but only one of the silicon hydroxyl groups of silane is bonded with the substrate surface at the interface, leaving two Si-OHs and condensation with Si-OHs in other silanes or free states. Therefore, the two materials with different properties can be coupled interfacially by using a silane-coupling agent, improving the composite properties, increasing the bonding strength, and obtaining a new composite with excellent performance and reliability.
Most wear occurs in the final mixing process, where the temperature is high and the mixer is in a closed state. In this high-temperature environment, ethanol vapor could not overflow the mixer, thereby resulting in corrosion wear. Accordingly, high-temperature, vapor-induced corrosion should be considered in investigating the friction and wear of the end face of the mixer. However, it is an enormous challenge to disassemble the end face of the internal mixer during the actual process and measure the quality of ethanol vapor. During the experiment on the CSM friction and wear testing machine, high-temperature ethanol vapor is sprayed on the surface of the mixing glue and metal in proportion to the degree of silylation reaction to simulate the mixing situation of the internal mixer.
Results
4.1 Dispersion analysis of the packing
4.1.1 Payne effect
The rubber compounds without GE and TESPT could not have a silanization reaction. Consequently, a chemical connection does not form between the silica and rubber, resulting in a poor silica dispersion. With the increase of the amount of GE, the Payne effect of the rubber compound increases gradually. The GE could intercalate between silica particles, isolate silica particles, and prevent silica agglomeration. Moreover, GE-intercalated silica affects the silica dispersion. Additionally, as the GE continuously increases, the agglomeration of GE became intensified, thereby increasing the Payne effect.
4.1.2 Dispersion comparison
The worst silica dispersion in the rubber compound belongs to the case without TESPT, which also has the highest silica aggregates. It is observed that as the amount of GE in the compound increases, the aggregate of GE increases, while the dispersion of the rubber compound decreases. The GE has a 2D crystal with a single atomic layer, which is composed of carbon atoms connected by sp2 hybridization. Therefore, GE intercalates silica particles, and its planar structure can hinder the silanization reaction.
4.2 Silanization reaction index
For the rubber compound of the silica formula system, the greater the silanization reaction index, the higher the degree of the silanization reaction, the more the overall dispersion of silica and rubber molecules and the better the silica dispersion. For the same formula system, the proportion of silanization reaction index reflects the proportion of silanization reaction product ethanol. In this regard, RPA 2000 was used, and the silanization reaction indices of five rubber compounds are evaluated.
The silylation reaction index of the mixers decreases gradually with the increase of the amount of GE. The products of the silanization reaction are ethanol and water. The wear of metal caused by water vapor has been studied, so the effect of produced ethanol from the silanization reaction was studied in this experiment. In the actual production process, it is a challenge to disassemble the internal mixer and measure the wear of the internal mixer face in real time, and it is not feasible to measure the quality of the produced ethanol vapor in the mixing process. In this experiment, when the wear test was carried out on the CSM, high-temperature ethanol vapor was sprayed on the surface of the rubber compound in proportion to the degree of the silylation reaction to simulate the real mixing process.
4.3 Effect of adding different amounts of GE on metal friction and wear
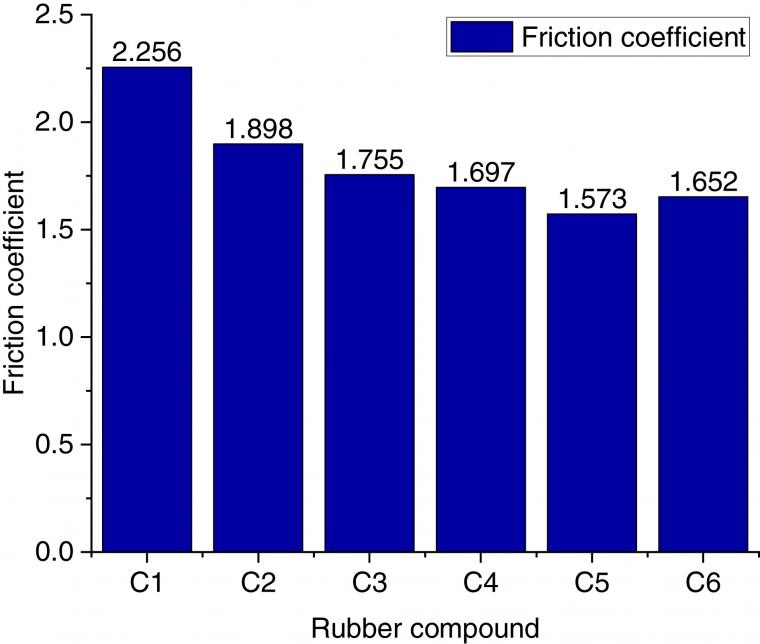
4.3.1 The coefficient of friction
Figure 3 reveals that the largest friction coefficient can be achieved in the rubber compound without TESPT and GE. This is because the silanization reaction of silica could not occur without adding TESPT in the mixing process. Accordingly, silica aggregates do not form easily among silica molecules. After adding TESPT, a silanization reaction occurs in the mixing process and a chemical bond establishes between silica and rubber. Accordingly, the silica dispersion increases and the aggregate of silica decreases. As a result, the friction coefficient of the C2 compound is significantly reduced compared to that of the C1 compound.
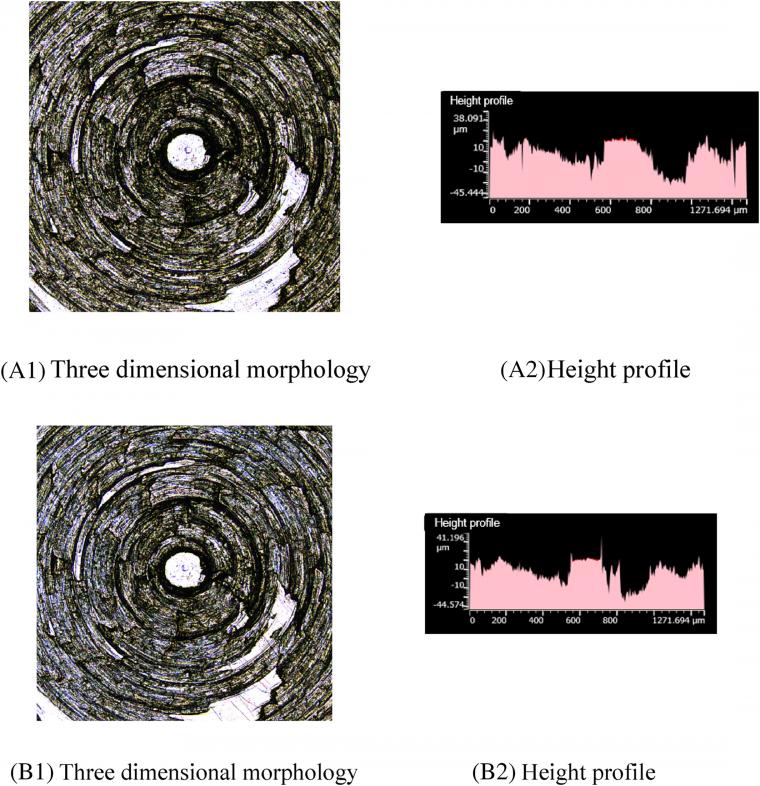
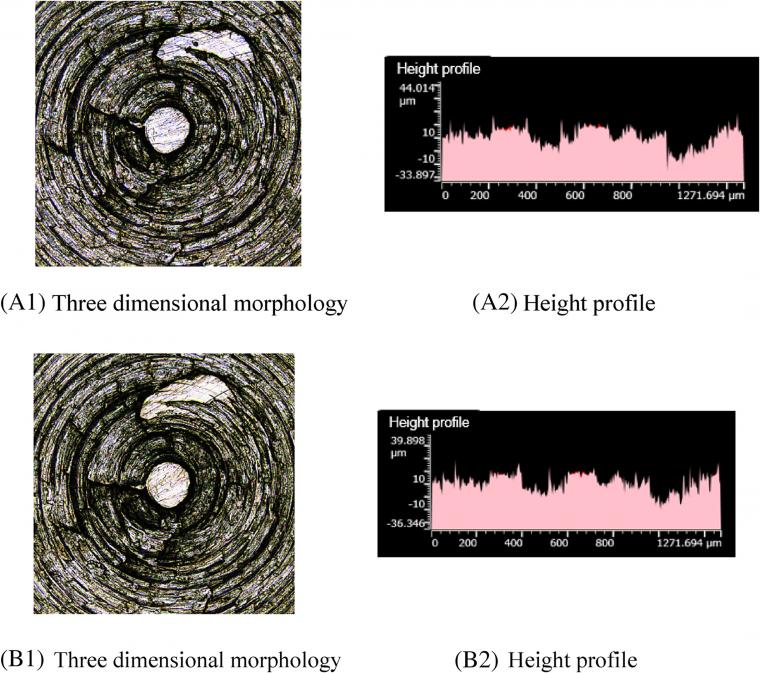
4.3.2 Three-dimensional morphology of metals
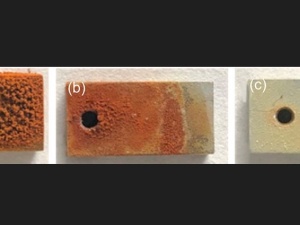
Comparing A1 and B1 in Figure 4, a large number of scratches appear on the metal surface after friction. Moreover, comparing A2 and B2, more pits appear on the height contour of the metal surface after friction, and the original height contour peaks mostly flatten. A large amount of silica aggregates in the rubber compound. Since silica has high hardness, the metal surface is worn so that many scratches appear on the metal surface after friction.
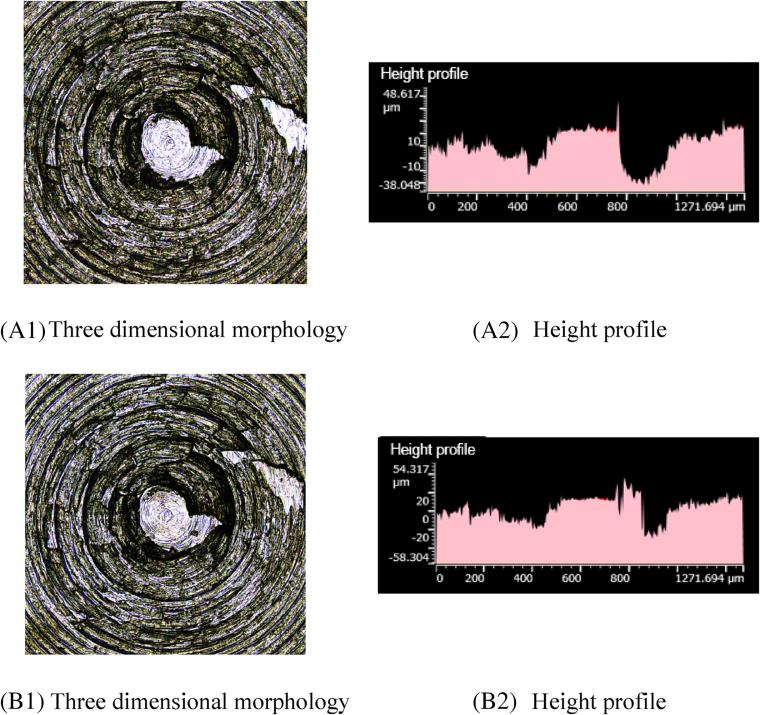
Comparing A1 and B1 in Figure 5, there are fewer scratches on the metal surface after friction. Furthermore, Figure 5 A2, B2 indicates that the height profile of the metal surface partially flattens after friction so that the peak of the height profile changed greatly. When TESPT is added to the compound mixture, the number of silica aggregates is lower. As a result, scratches on the metal surface reduce. However, with the progress of the silanization reaction, the temperature of ethanol vapor gradually increases and has a corrosive effect on metal. Considering the friction of the mixing adhesive on metal, this phenomenon results in the production of highly corrosive wear. Therefore, although there were few scratches on the metal surface, the height profile of the metal surface changed greatly, and the wear vapor-induced corrosion becomes the worst case.
Comparing A1 and B1 in Figure 6, more scratches appear on the metal surface after friction. Furthermore, Figure 6 A2, B2 indicates that a large part of the height contour peaks of the metal surface flatten and pits appear in the height contour. GE intercalates silica particles, and its planar structure hinders the silylation reaction. Therefore, with the addition of 1 phr GE, the silanization reaction index and the amount of high-temperature ethanol vapor decrease, and the amount of corrosive wear decreases. Since GE has reasonable toughness and the intercalation of GE between silica particles hinders the contact between silica aggregates and metals, the amount of abrasive wear reduces.
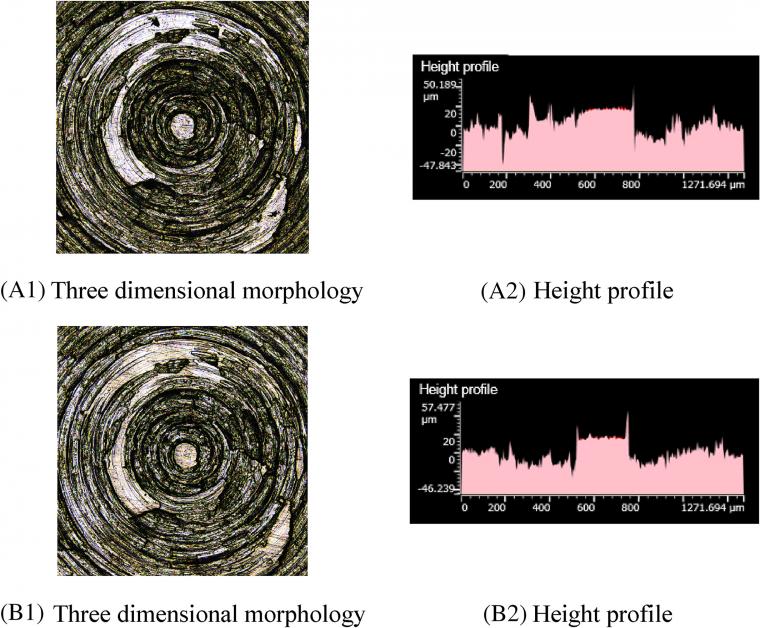
Figure 7 A1, B1 shows that there are fewer scratches on the metal surface after friction. Figure 7 A2, B2 illustrates that a small number of height peaks on the metal surface flatten after friction, and the overall change of height contour peaks is negligible. This phenomenon mainly originates from GE intercalation between silica particles, which further hinders the contact between silica aggregates and the base metal. It is observed that as the GE content increases, the corrosion wear decreases significantly.
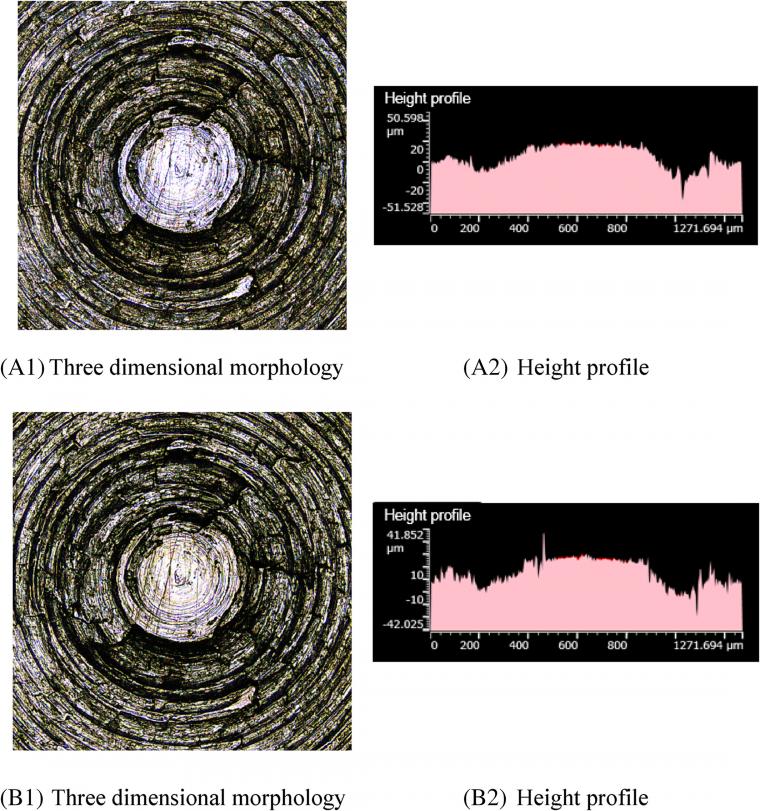
Similar to previous parts, Figure 8 A1, B1 shows that there are fewer scratches on the metal surface after friction. Moreover, Figure 8 A2, B2 indicates that the height profile of the metal surface slightly changes after friction. This phenomenon may be attributed to the GE lamellae further hindering the contact between silica aggregates and metals. In this case, the metal contacts with the silica aggregate only when a piece of GE was worn completely, and then another GE layer appears. As the GE content increases, the silylation reaction index further decreases and the high-temperature steam decreases, thereby reducing the corrosion wear.
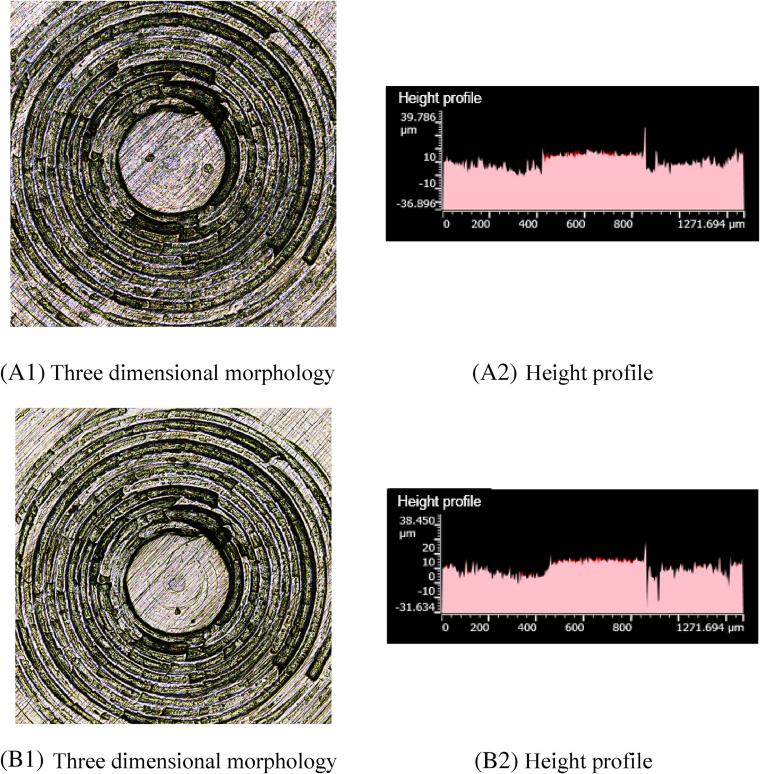
Figure 9 A1, B1 shows that there are more scratches on the metal surface after friction. Figure 9 A2, B2 shows that after friction, part of the height contour peak of the metal surface flattens, pits appear in the height contour, and the overall height contour changes greatly. When 4 phr GE is added to the compound, a large amount of agglomeration between GE and TESPT is wrapped by GE, which hinders the silanization reaction, thereby producing a small amount of high-temperature ethanol vapor and a low amount of corrosive wear. Meanwhile, the hindrance of silica particles by GE sheets reduces, and a large number of silica aggregates appear. Consequently, the rubber compound with 4 phr GE has the largest abrasive wear on the metal.
4.3.3 Metal wear volume
TESPT has the largest wear on the metal. It is observed that with the gradual increase of the GE content, the wear of the rubber compound on the metal decreases first and then increases. The minimum wear can be achieved when 3 phr GE was added. When the amount of GE exceeds 3 phr, the wear amount of the rubber compound on the metal increases.
TESPT was an important raw material for silanization reaction. There is no TESPT in compound C1, so a silanization reaction cannot occur. Therefore, silica dispersion in this compound is very poor so that more and large silica aggregates appear. The friction of silica aggregates on the metal is the most important source of abrasive wear. Accordingly, the rubber compound C1 has great abrasive wear on the metal. After adding TESPT, the silica dispersion increases so that the silica aggregate decreases. More specifically, the metal wear of C2 rubber compound reduces by 7.22% compared with that of the C1 rubber compound.
As the amount of GE further increases, the GE lamellae further hinder the contact between silica aggregates and metals, and the wear of the rubber compound on the metal decreases. However, when the amount of GE exceeded 3 phr, a large number of GE agglomerates and GE encapsulated TESPT, which hindered the silanization reaction. Accordingly, small amounts of high-temperature steam and corrosive wear are produced. With a large number of GE aggregates, the blocking effect of GE sheets on silica particles is reduced, and a large number of silica aggregates appear in the rubber compound. Among the studied compounds, the rubber compound with 4 phr GE has the largest wear capacity on the metal.
4.3.4 Proportion of corrosive and abrasive wear
The CSM friction and wear tests were carried out on the rubber compound without spraying high-temperature ethanol vapor, so there is no corrosive wear so that abrasive wear is the only wear mechanism.
It was found that GE intercalates silica particles, hinders the movement of silica particles, and reduces the silica dispersion. Moreover, GE laminate could wrap TESPT and reduce the occurrence of silylation reaction. Therefore, as the GE content increases, the degree of the silanization reaction decreases. Meanwhile, the production of high-temperature steam decreases, thereby reducing the proportion of corrosion wear to abrasive wear.
4.3.5 Roughness changes before and after friction
The largest surface roughness can be achieved for the compound with no TESPT. This may be attributed to the absence of silanization reaction so that the silica aggregates. On the other hand, with the increase of the amount of GE, the silanization reaction decreases so that silica aggregates. Therefore, with the increase of the amount of GE, the surface roughness gradually increases after the metal friction was rubbed by the rubber compound.
Conclusion
Based on the results, it was found that as the amount of GE in the rubber compound increases, the proportion of abrasive wear on the metal increases, the proportion of corrosive wear on the metal decreases, and the metal wear decreases first and then increases. With the increase of the GE content, the production of high-temperature steam and the proportion of corrosive wear decreases.
The lowest metal wear can be achieved when the GE amount is 3 phr. However, when the GE amount exceeds 3 phr, a large number of GE agglomerates and GE encapsulated TESPT, which hinders the silanization reaction, resulting in a small amount of high-temperature steam production and a low amount of corrosion wear. However, with a large number of GE aggregated, the blocking effect of GE sheets on silica particles reduces, and a large number of silica aggregates appear in the rubber compound. Therefore, the mixing compound with 4 phr GE has greater wear on the metal.
Acknowledgments
This research was funded by Key Technology and Equipment for Intelligent Green Manufacturing of Rubber Products, grant number ZR2016XJ003; Natural Science Foundation of Shandong Province, grant number ZR2019BEE056; Polymer Material Intelligent Manufacturing Innovation Team, grant number 2019KJB007; Key R & D Plan of Shandong Province, grant number 2019GGX102018; Shandong Provincial Natural Science Foundation, grant number ZR2020QE207;and also funded by Hunan Province 121 innovative talents project. The funders contributed to the work. The authors would like to thank the Shandong Provincial Key Laboratory of Polymer Material Advanced Manufacturing Technology for their support in this experiment.
References
[1] Y. Lin, S. Liu, J. Peng, L. Liu, Appl. Sci. Manuf. 2016, 86, 19.
[2] X. Zhang, J. Wang, H. Jia, S. You, X. Xiong, L. Ding, Z. Xu, Compos. Part B 2016, 84, 121.
[3] H. Zhu, Z. Wang, X. Huang, F. Wang, L. Kong, B. Guo, T. Ding, Compos. Part B 2019, 175, 107027.
[4] Y. Wu, L. Chen, S. Qin, J. Li, H. Zhou, J. Chen, J. Appl. Polym. Sci. 2017, 134, 44970.
[5] D. S. Han, S. Zhang, K. Wang, Y. Pan, D. Zhu, J. Appl. Polym. Sci. 2021, 138, e50761.
[6] S. Geng, P. Wang, T. Ding, Compos. Sci. Technol. 2011, 72, 36.
[7] M. A. Tarawneh, S. H. Ahmad, S. Y. Yahya, R. Rasid, S. Y.
Noum, J. Reinf. Plast. Compos. 2011, 30, 363.
[8] P. M. Ajayan, O. Stephan, C. Colliex, D. Trauth, Science 1994, 256, 1212.
[9] L. Shen, X. Zhang, Y. Lei, M. Liang, Y. Chen, W. Chen, H. Zou, Polym. Compos. 2021, 1. https://doi.org/10.1002/pc.26165.
[10] H. Yan, T. Yuanzheng, J. Theor. Comput. Chem. 2013, 12, 1.
[11] X. Li, Y. Xia, Acta Mater. Compos. Sin. 2015, 32, 1007.
[12] Z. Xu, Y. Song, Q. Zheng, Polymer 2019, 185, 121953.
[13] J. Flambard, F. Carrette, C. Monchy-Leroy, E. Andrieu, L. Laffont, J. Nucl. Mater. 2021, 543, 152562.
[14] B. Arkles, J. R. Steinmetz, J. Zazyczny, P. Mehta, J. Adhes. Sci. Technol. 1992, 6, 193.
Original article:
Han, D., Wang, K., Bian, H., Yan, G., Wang, C., Polymer Composites 2021, 42( 10), 5075. https://doi.org/10.1002/pc.26206
Source: Preview Image: Science Photo Library RF/Getty Images